
 Yahoo Finance
 Investors Should Be Encouraged By John B. Sanfilippo & Son's (NASDAQ:JBSS) Returns On Capital
Finding a business that has the potential to grow substantially is not easy, but it is possible if we look at a few key financial metrics. Firstly, we'll want to see a proven return on capital employed (ROCE) that is increasing, and secondly, an expanding base of capital employed. If you see this, it typically means it's a company with a great business model and plenty of profitable reinvestment opportunities. And in light of that, the trends we're seeing at John B. Sanfilippo & Son's (NASDAQ:JBSS) look very promising so lets take a look.
What Is Return On Capital Employed (ROCE)?
For those that aren't sure what ROCE is, it measures the amount of pre-tax profits a company can generate from the capital employed in its business. Analysts use this formula to calculate it for John B. Sanfilippo & Son:
Return on Capital Employed = Earnings Before Interest and Tax (EBIT) ÷ (Total Assets - Current Liabilities)
0.23 = US$87m ÷ (US$492m - US$120m) (Based on the trailing twelve months to March 2024).
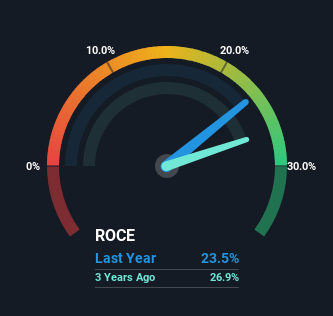
Therefore, John B. Sanfilippo & Son has an ROCE of 23%. In absolute terms that's a great return and it's even better than the Food industry average of 11%.
See our latest analysis for John B. Sanfilippo & Son
While the past is not representative of the future, it can be helpful to know how a company has performed historically, which is why we have this chart above. If you're interested in investigating John B. Sanfilippo & Son's past further, check out this free graph covering John B. Sanfilippo & Son's past earnings, revenue and cash flow.
What Does the ROCE Trend For John B. Sanfilippo & Son Tell Us?
The trends we've noticed at John B. Sanfilippo & Son are quite reassuring. Over the last five years, returns on capital employed have risen substantially to 23%. Basically the business is earning more per dollar of capital invested and in addition to that, 26% more capital is being employed now too. So we're very much inspired by what we're seeing at John B. Sanfilippo & Son thanks to its ability to profitably reinvest capital.
What We Can Learn From John B. Sanfilippo & Son's ROCE
A company that is growing its returns on capital and can consistently reinvest in itself is a highly sought after trait, and that's what John B. Sanfilippo & Son has. And with a respectable 54% awarded to those who held the stock over the last five years, you could argue that these developments are starting to get the attention they deserve. So given the stock has proven it has promising trends, it's worth researching the company further to see if these trends are likely to persist.
On a final note, we've found 1 warning sign for John B. Sanfilippo & Son that we think you should be aware of.
High returns are a key ingredient to strong performance, so check out our free list ofstocks earning high returns on equity with solid balance sheets.
Have feedback on this article? Concerned about the content? Get in touch with us directly. Alternatively, email editorial-team (at) simplywallst.com.
This article by Simply Wall St is general in nature. We provide commentary based on historical data and analyst forecasts only using an unbiased methodology and our articles are not intended to be financial advice. It does not constitute a recommendation to buy or sell any stock, and does not take account of your objectives, or your financial situation. We aim to bring you long-term focused analysis driven by fundamental data. Note that our analysis may not factor in the latest price-sensitive company announcements or qualitative material. Simply Wall St has no position in any stocks mentioned.
Have feedback on this article? Concerned about the content? Get in touch with us directly. Alternatively, email editorial-team@simplywallst.com
