
 Yahoo Finance
 Investors Should Be Encouraged By JB Hi-Fi's (ASX:JBH) Returns On Capital
If we want to find a potential multi-bagger, often there are underlying trends that can provide clues. Firstly, we'll want to see a proven return on capital employed (ROCE) that is increasing, and secondly, an expanding base of capital employed. Ultimately, this demonstrates that it's a business that is reinvesting profits at increasing rates of return. And in light of that, the trends we're seeing at JB Hi-Fi's (ASX:JBH) look very promising so lets take a look.
Return On Capital Employed (ROCE): What Is It?
If you haven't worked with ROCE before, it measures the 'return' (pre-tax profit) a company generates from capital employed in its business. The formula for this calculation on JB Hi-Fi is:
Return on Capital Employed = Earnings Before Interest and Tax (EBIT) ÷ (Total Assets - Current Liabilities)
0.32 = AU$677m ÷ (AU$3.7b - AU$1.6b) (Based on the trailing twelve months to December 2023).
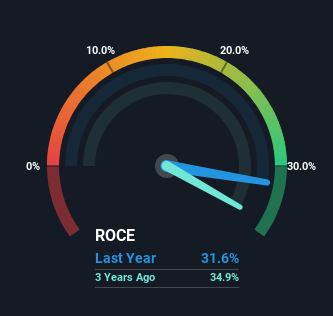
Thus, JB Hi-Fi has an ROCE of 32%. In absolute terms that's a great return and it's even better than the Specialty Retail industry average of 18%.
Check out our latest analysis for JB Hi-Fi
In the above chart we have measured JB Hi-Fi's prior ROCE against its prior performance, but the future is arguably more important. If you'd like to see what analysts are forecasting going forward, you should check out our free analyst report for JB Hi-Fi .
What Does the ROCE Trend For JB Hi-Fi Tell Us?
We like the trends that we're seeing from JB Hi-Fi. The data shows that returns on capital have increased substantially over the last five years to 32%. The company is effectively making more money per dollar of capital used, and it's worth noting that the amount of capital has increased too, by 40%. So we're very much inspired by what we're seeing at JB Hi-Fi thanks to its ability to profitably reinvest capital.
On a separate but related note, it's important to know that JB Hi-Fi has a current liabilities to total assets ratio of 43%, which we'd consider pretty high. This effectively means that suppliers (or short-term creditors) are funding a large portion of the business, so just be aware that this can introduce some elements of risk. Ideally we'd like to see this reduce as that would mean fewer obligations bearing risks.
The Bottom Line
All in all, it's terrific to see that JB Hi-Fi is reaping the rewards from prior investments and is growing its capital base. And with the stock having performed exceptionally well over the last five years, these patterns are being accounted for by investors. So given the stock has proven it has promising trends, it's worth researching the company further to see if these trends are likely to persist.
One more thing: We've identified 2 warning signs with JB Hi-Fi (at least 1 which is a bit concerning) , and understanding them would certainly be useful.
JB Hi-Fi is not the only stock earning high returns. If you'd like to see more, check out our free list of companies earning high returns on equity with solid fundamentals.
Have feedback on this article? Concerned about the content? Get in touch with us directly. Alternatively, email editorial-team (at) simplywallst.com.
This article by Simply Wall St is general in nature. We provide commentary based on historical data and analyst forecasts only using an unbiased methodology and our articles are not intended to be financial advice. It does not constitute a recommendation to buy or sell any stock, and does not take account of your objectives, or your financial situation. We aim to bring you long-term focused analysis driven by fundamental data. Note that our analysis may not factor in the latest price-sensitive company announcements or qualitative material. Simply Wall St has no position in any stocks mentioned.
Have feedback on this article? Concerned about the content? Get in touch with us directly. Alternatively, email editorial-team@simplywallst.com
