
 Yahoo Finance
 Investors Could Be Concerned With Muhibbah Engineering (M) Bhd's (KLSE:MUHIBAH) Returns On Capital
If we're looking to avoid a business that is in decline, what are the trends that can warn us ahead of time? A business that's potentially in decline often shows two trends, a return on capital employed (ROCE) that's declining, and a base of capital employed that's also declining. This indicates to us that the business is not only shrinking the size of its net assets, but its returns are falling as well. So after glancing at the trends within Muhibbah Engineering (M) Bhd (KLSE:MUHIBAH), we weren't too hopeful.
Return On Capital Employed (ROCE): What Is It?
For those that aren't sure what ROCE is, it measures the amount of pre-tax profits a company can generate from the capital employed in its business. Analysts use this formula to calculate it for Muhibbah Engineering (M) Bhd:
Return on Capital Employed = Earnings Before Interest and Tax (EBIT) ÷ (Total Assets - Current Liabilities)
0.0094 = RM20m ÷ (RM3.5b - RM1.4b) (Based on the trailing twelve months to December 2023).
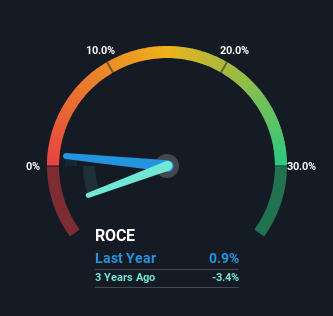
So, Muhibbah Engineering (M) Bhd has an ROCE of 0.9%. Ultimately, that's a low return and it under-performs the Construction industry average of 6.6%.
Check out our latest analysis for Muhibbah Engineering (M) Bhd
In the above chart we have measured Muhibbah Engineering (M) Bhd's prior ROCE against its prior performance, but the future is arguably more important. If you'd like, you can check out the forecasts from the analysts covering Muhibbah Engineering (M) Bhd for free.
What Does the ROCE Trend For Muhibbah Engineering (M) Bhd Tell Us?
In terms of Muhibbah Engineering (M) Bhd's historical ROCE movements, the trend doesn't inspire confidence. To be more specific, the ROCE was 6.7% five years ago, but since then it has dropped noticeably. On top of that, it's worth noting that the amount of capital employed within the business has remained relatively steady. Since returns are falling and the business has the same amount of assets employed, this can suggest it's a mature business that hasn't had much growth in the last five years. So because these trends aren't typically conducive to creating a multi-bagger, we wouldn't hold our breath on Muhibbah Engineering (M) Bhd becoming one if things continue as they have.
On a side note, Muhibbah Engineering (M) Bhd has done well to pay down its current liabilities to 40% of total assets. So we could link some of this to the decrease in ROCE. Effectively this means their suppliers or short-term creditors are funding less of the business, which reduces some elements of risk. Since the business is basically funding more of its operations with it's own money, you could argue this has made the business less efficient at generating ROCE. Keep in mind 40% is still pretty high, so those risks are still somewhat prevalent.
In Conclusion...
All in all, the lower returns from the same amount of capital employed aren't exactly signs of a compounding machine. Investors haven't taken kindly to these developments, since the stock has declined 60% from where it was five years ago. Unless there is a shift to a more positive trajectory in these metrics, we would look elsewhere.
While Muhibbah Engineering (M) Bhd doesn't shine too bright in this respect, it's still worth seeing if the company is trading at attractive prices. You can find that out with our FREE intrinsic value estimation for MUHIBAH on our platform.
For those who like to invest in solid companies, check out this free list of companies with solid balance sheets and high returns on equity.
Have feedback on this article? Concerned about the content? Get in touch with us directly. Alternatively, email editorial-team (at) simplywallst.com.
This article by Simply Wall St is general in nature. We provide commentary based on historical data and analyst forecasts only using an unbiased methodology and our articles are not intended to be financial advice. It does not constitute a recommendation to buy or sell any stock, and does not take account of your objectives, or your financial situation. We aim to bring you long-term focused analysis driven by fundamental data. Note that our analysis may not factor in the latest price-sensitive company announcements or qualitative material. Simply Wall St has no position in any stocks mentioned.
