
 Yahoo Finance
 Investing in StealthGas (NASDAQ:GASS) three years ago would have delivered you a 166% gain
The worst result, after buying shares in a company (assuming no leverage), would be if you lose all the money you put in. But if you buy shares in a really great company, you can more than double your money. To wit, the StealthGas Inc. (NASDAQ:GASS) share price has flown 161% in the last three years. Most would be happy with that. On top of that, the share price is up 27% in about a quarter.
So let's investigate and see if the longer term performance of the company has been in line with the underlying business' progress.
Check out our latest analysis for StealthGas
While the efficient markets hypothesis continues to be taught by some, it has been proven that markets are over-reactive dynamic systems, and investors are not always rational. One flawed but reasonable way to assess how sentiment around a company has changed is to compare the earnings per share (EPS) with the share price.
During three years of share price growth, StealthGas achieved compound earnings per share growth of 78% per year. The average annual share price increase of 38% is actually lower than the EPS growth. So one could reasonably conclude that the market has cooled on the stock. This cautious sentiment is reflected in its (fairly low) P/E ratio of 5.16.
You can see below how EPS has changed over time (discover the exact values by clicking on the image).
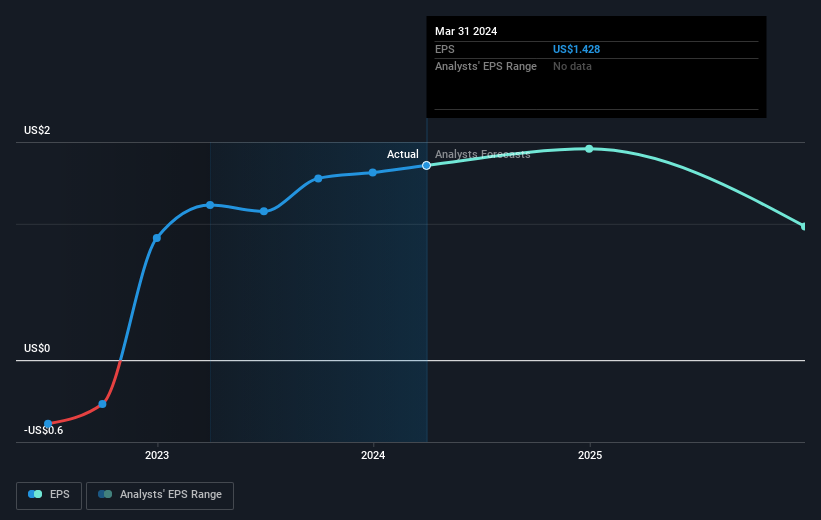
We know that StealthGas has improved its bottom line over the last three years, but what does the future have in store? If you are thinking of buying or selling StealthGas stock, you should check out this FREE detailed report on its balance sheet.
What About The Total Shareholder Return (TSR)?
We'd be remiss not to mention the difference between StealthGas' total shareholder return (TSR) and its share price return. The TSR attempts to capture the value of dividends (as if they were reinvested) as well as any spin-offs or discounted capital raisings offered to shareholders. StealthGas hasn't been paying dividends, but its TSR of 166% exceeds its share price return of 161%, implying it has either spun-off a business, or raised capital at a discount; thereby providing additional value to shareholders.
A Different Perspective
It's good to see that StealthGas has rewarded shareholders with a total shareholder return of 96% in the last twelve months. That gain is better than the annual TSR over five years, which is 17%. Therefore it seems like sentiment around the company has been positive lately. Someone with an optimistic perspective could view the recent improvement in TSR as indicating that the business itself is getting better with time. I find it very interesting to look at share price over the long term as a proxy for business performance. But to truly gain insight, we need to consider other information, too. To that end, you should be aware of the 1 warning sign we've spotted with StealthGas .
Of course, you might find a fantastic investment by looking elsewhere. So take a peek at this free list of companies we expect will grow earnings.
Please note, the market returns quoted in this article reflect the market weighted average returns of stocks that currently trade on American exchanges.
Have feedback on this article? Concerned about the content? Get in touch with us directly. Alternatively, email editorial-team (at) simplywallst.com.
This article by Simply Wall St is general in nature. We provide commentary based on historical data and analyst forecasts only using an unbiased methodology and our articles are not intended to be financial advice. It does not constitute a recommendation to buy or sell any stock, and does not take account of your objectives, or your financial situation. We aim to bring you long-term focused analysis driven by fundamental data. Note that our analysis may not factor in the latest price-sensitive company announcements or qualitative material. Simply Wall St has no position in any stocks mentioned.
Have feedback on this article? Concerned about the content? Get in touch with us directly. Alternatively, email editorial-team@simplywallst.com
