
 Yahoo Finance
 Investing in SRG Global (ASX:SRG) five years ago would have delivered you a 117% gain
Stock pickers are generally looking for stocks that will outperform the broader market. And while active stock picking involves risks (and requires diversification) it can also provide excess returns. For example, the SRG Global Limited (ASX:SRG) share price is up 75% in the last 5 years, clearly besting the market return of around 16% (ignoring dividends). On the other hand, the more recent gains haven't been so impressive, with shareholders gaining just 22%, including dividends.
So let's assess the underlying fundamentals over the last 5 years and see if they've moved in lock-step with shareholder returns.
See our latest analysis for SRG Global
While the efficient markets hypothesis continues to be taught by some, it has been proven that markets are over-reactive dynamic systems, and investors are not always rational. One flawed but reasonable way to assess how sentiment around a company has changed is to compare the earnings per share (EPS) with the share price.
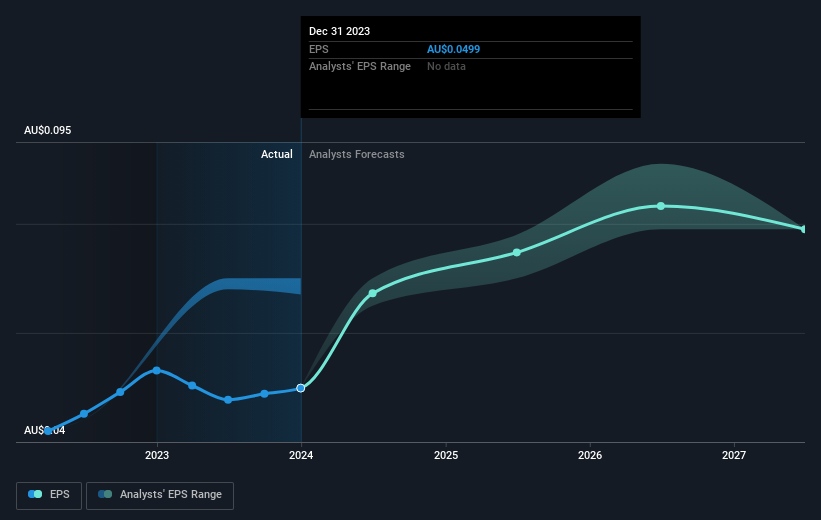
During the last half decade, SRG Global became profitable. That's generally thought to be a genuine positive, so investors may expect to see an increasing share price.
You can see how EPS has changed over time in the image below (click on the chart to see the exact values).
We consider it positive that insiders have made significant purchases in the last year. Having said that, most people consider earnings and revenue growth trends to be a more meaningful guide to the business. Before buying or selling a stock, we always recommend a close examination of historic growth trends, available here..
What About Dividends?
As well as measuring the share price return, investors should also consider the total shareholder return (TSR). Whereas the share price return only reflects the change in the share price, the TSR includes the value of dividends (assuming they were reinvested) and the benefit of any discounted capital raising or spin-off. It's fair to say that the TSR gives a more complete picture for stocks that pay a dividend. In the case of SRG Global, it has a TSR of 117% for the last 5 years. That exceeds its share price return that we previously mentioned. And there's no prize for guessing that the dividend payments largely explain the divergence!
A Different Perspective
We're pleased to report that SRG Global shareholders have received a total shareholder return of 22% over one year. And that does include the dividend. Since the one-year TSR is better than the five-year TSR (the latter coming in at 17% per year), it would seem that the stock's performance has improved in recent times. Someone with an optimistic perspective could view the recent improvement in TSR as indicating that the business itself is getting better with time. It's always interesting to track share price performance over the longer term. But to understand SRG Global better, we need to consider many other factors. For instance, we've identified 1 warning sign for SRG Global that you should be aware of.
There are plenty of other companies that have insiders buying up shares. You probably do not want to miss this free list of undervalued small cap companies that insiders are buying.
Please note, the market returns quoted in this article reflect the market weighted average returns of stocks that currently trade on Australian exchanges.
Have feedback on this article? Concerned about the content? Get in touch with us directly. Alternatively, email editorial-team (at) simplywallst.com.
This article by Simply Wall St is general in nature. We provide commentary based on historical data and analyst forecasts only using an unbiased methodology and our articles are not intended to be financial advice. It does not constitute a recommendation to buy or sell any stock, and does not take account of your objectives, or your financial situation. We aim to bring you long-term focused analysis driven by fundamental data. Note that our analysis may not factor in the latest price-sensitive company announcements or qualitative material. Simply Wall St has no position in any stocks mentioned.
Have feedback on this article? Concerned about the content? Get in touch with us directly. Alternatively, email editorial-team@simplywallst.com
