
 Yahoo Finance
 Investing in Sheng Siong Group (SGX:OV8) five years ago would have delivered you a 73% gain
Stock pickers are generally looking for stocks that will outperform the broader market. And while active stock picking involves risks (and requires diversification) it can also provide excess returns. For example, the Sheng Siong Group Ltd (SGX:OV8) share price is up 45% in the last 5 years, clearly besting the market decline of around 21% (ignoring dividends).
Let's take a look at the underlying fundamentals over the longer term, and see if they've been consistent with shareholders returns.
Check out our latest analysis for Sheng Siong Group
While the efficient markets hypothesis continues to be taught by some, it has been proven that markets are over-reactive dynamic systems, and investors are not always rational. One flawed but reasonable way to assess how sentiment around a company has changed is to compare the earnings per share (EPS) with the share price.
Over half a decade, Sheng Siong Group managed to grow its earnings per share at 14% a year. This EPS growth is higher than the 8% average annual increase in the share price. Therefore, it seems the market has become relatively pessimistic about the company.
The image below shows how EPS has tracked over time (if you click on the image you can see greater detail).
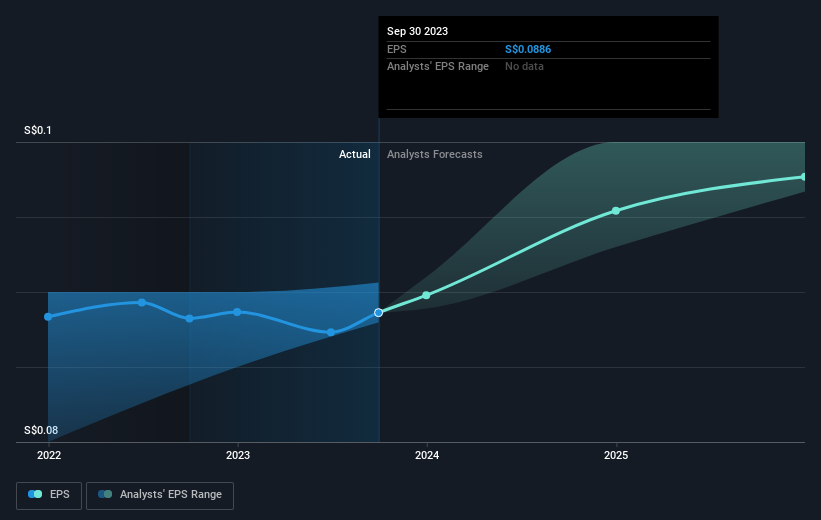
This free interactive report on Sheng Siong Group's earnings, revenue and cash flow is a great place to start, if you want to investigate the stock further.
What About Dividends?
As well as measuring the share price return, investors should also consider the total shareholder return (TSR). Whereas the share price return only reflects the change in the share price, the TSR includes the value of dividends (assuming they were reinvested) and the benefit of any discounted capital raising or spin-off. Arguably, the TSR gives a more comprehensive picture of the return generated by a stock. We note that for Sheng Siong Group the TSR over the last 5 years was 73%, which is better than the share price return mentioned above. This is largely a result of its dividend payments!
A Different Perspective
Although it hurts that Sheng Siong Group returned a loss of 0.7% in the last twelve months, the broader market was actually worse, returning a loss of 1.2%. Longer term investors wouldn't be so upset, since they would have made 12%, each year, over five years. In the best case scenario the last year is just a temporary blip on the journey to a brighter future. It's always interesting to track share price performance over the longer term. But to understand Sheng Siong Group better, we need to consider many other factors. To that end, you should be aware of the 1 warning sign we've spotted with Sheng Siong Group .
If you are like me, then you will not want to miss this free list of growing companies that insiders are buying.
Please note, the market returns quoted in this article reflect the market weighted average returns of stocks that currently trade on Singaporean exchanges.
Have feedback on this article? Concerned about the content? Get in touch with us directly. Alternatively, email editorial-team (at) simplywallst.com.
This article by Simply Wall St is general in nature. We provide commentary based on historical data and analyst forecasts only using an unbiased methodology and our articles are not intended to be financial advice. It does not constitute a recommendation to buy or sell any stock, and does not take account of your objectives, or your financial situation. We aim to bring you long-term focused analysis driven by fundamental data. Note that our analysis may not factor in the latest price-sensitive company announcements or qualitative material. Simply Wall St has no position in any stocks mentioned.
