
 Yahoo Finance
 Investing in Kier Group (LON:KIE) a year ago would have delivered you a 81% gain
These days it's easy to simply buy an index fund, and your returns should (roughly) match the market. But investors can boost returns by picking market-beating companies to own shares in. To wit, the Kier Group plc (LON:KIE) share price is 79% higher than it was a year ago, much better than the market return of around 5.6% (not including dividends) in the same period. So that should have shareholders smiling. Having said that, the longer term returns aren't so impressive, with stock gaining just 17% in three years.
So let's investigate and see if the longer term performance of the company has been in line with the underlying business' progress.
View our latest analysis for Kier Group
To paraphrase Benjamin Graham: Over the short term the market is a voting machine, but over the long term it's a weighing machine. By comparing earnings per share (EPS) and share price changes over time, we can get a feel for how investor attitudes to a company have morphed over time.
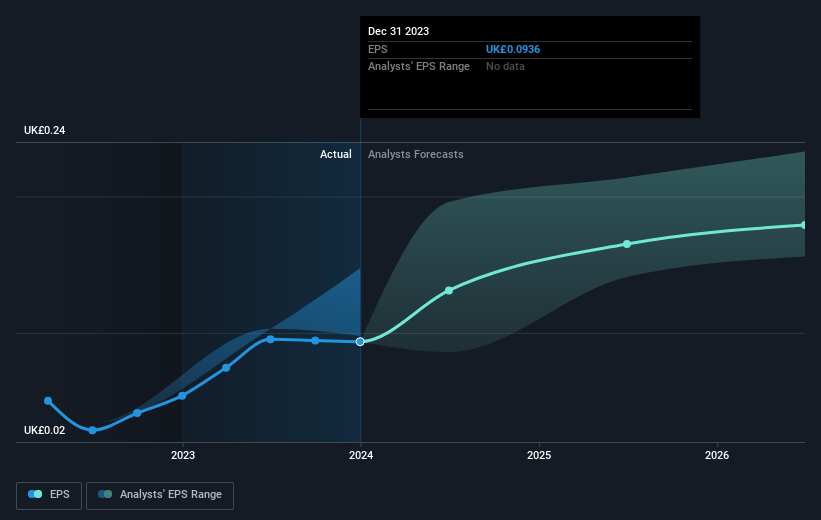
During the last year Kier Group grew its earnings per share (EPS) by 73%. This EPS growth is reasonably close to the 79% increase in the share price. This makes us think the market hasn't really changed its sentiment around the company, in the last year. We don't think its coincidental that the share price is growing at a similar rate to the earnings per share.
You can see how EPS has changed over time in the image below (click on the chart to see the exact values).
It is of course excellent to see how Kier Group has grown profits over the years, but the future is more important for shareholders. If you are thinking of buying or selling Kier Group stock, you should check out this FREE detailed report on its balance sheet.
What About Dividends?
As well as measuring the share price return, investors should also consider the total shareholder return (TSR). The TSR incorporates the value of any spin-offs or discounted capital raisings, along with any dividends, based on the assumption that the dividends are reinvested. So for companies that pay a generous dividend, the TSR is often a lot higher than the share price return. As it happens, Kier Group's TSR for the last 1 year was 81%, which exceeds the share price return mentioned earlier. The dividends paid by the company have thusly boosted the total shareholder return.
A Different Perspective
It's good to see that Kier Group has rewarded shareholders with a total shareholder return of 81% in the last twelve months. That's including the dividend. That's better than the annualised return of 8% over half a decade, implying that the company is doing better recently. In the best case scenario, this may hint at some real business momentum, implying that now could be a great time to delve deeper. I find it very interesting to look at share price over the long term as a proxy for business performance. But to truly gain insight, we need to consider other information, too. Take risks, for example - Kier Group has 2 warning signs we think you should be aware of.
If you are like me, then you will not want to miss this free list of undervalued small caps that insiders are buying.
Please note, the market returns quoted in this article reflect the market weighted average returns of stocks that currently trade on British exchanges.
Have feedback on this article? Concerned about the content? Get in touch with us directly. Alternatively, email editorial-team (at) simplywallst.com.
This article by Simply Wall St is general in nature. We provide commentary based on historical data and analyst forecasts only using an unbiased methodology and our articles are not intended to be financial advice. It does not constitute a recommendation to buy or sell any stock, and does not take account of your objectives, or your financial situation. We aim to bring you long-term focused analysis driven by fundamental data. Note that our analysis may not factor in the latest price-sensitive company announcements or qualitative material. Simply Wall St has no position in any stocks mentioned.
Have feedback on this article? Concerned about the content? Get in touch with us directly. Alternatively, email editorial-team@simplywallst.com
