
 Yahoo Finance
 Investing in IDT (NYSE:IDT) five years ago would have delivered you a 206% gain
The most you can lose on any stock (assuming you don't use leverage) is 100% of your money. But on the bright side, you can make far more than 100% on a really good stock. For instance, the price of IDT Corporation (NYSE:IDT) stock is up an impressive 205% over the last five years. In contrast, the stock has fallen 9.9% in the last 30 days. The company reported its financial results recently; you can catch up on the latest numbers by reading our company report.
So let's investigate and see if the longer term performance of the company has been in line with the underlying business' progress.
View our latest analysis for IDT
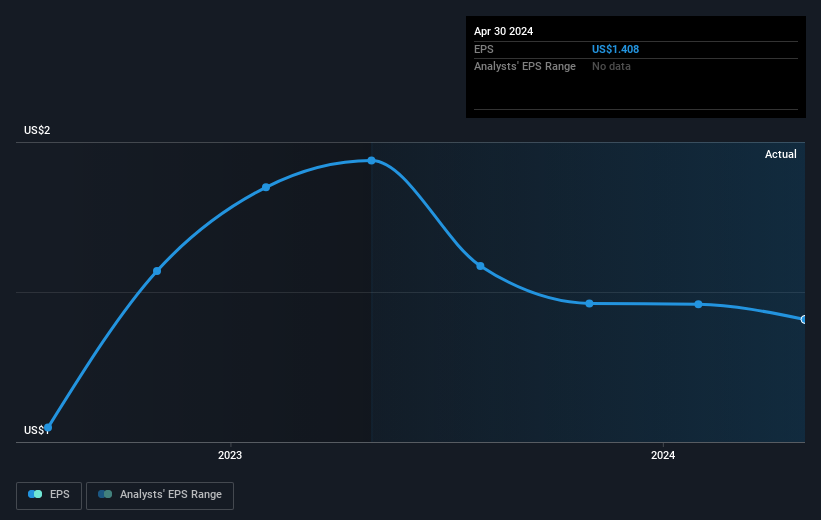
There is no denying that markets are sometimes efficient, but prices do not always reflect underlying business performance. One imperfect but simple way to consider how the market perception of a company has shifted is to compare the change in the earnings per share (EPS) with the share price movement.
Over half a decade, IDT managed to grow its earnings per share at 39% a year. The EPS growth is more impressive than the yearly share price gain of 25% over the same period. So it seems the market isn't so enthusiastic about the stock these days.
You can see how EPS has changed over time in the image below (click on the chart to see the exact values).
It's probably worth noting that the CEO is paid less than the median at similar sized companies. It's always worth keeping an eye on CEO pay, but a more important question is whether the company will grow earnings throughout the years. Before buying or selling a stock, we always recommend a close examination of historic growth trends, available here..
A Different Perspective
We're pleased to report that IDT shareholders have received a total shareholder return of 40% over one year. That's including the dividend. That's better than the annualised return of 25% over half a decade, implying that the company is doing better recently. In the best case scenario, this may hint at some real business momentum, implying that now could be a great time to delve deeper. Most investors take the time to check the data on insider transactions. You can click here to see if insiders have been buying or selling.
But note: IDT may not be the best stock to buy. So take a peek at this free list of interesting companies with past earnings growth (and further growth forecast).
Please note, the market returns quoted in this article reflect the market weighted average returns of stocks that currently trade on American exchanges.
Have feedback on this article? Concerned about the content? Get in touch with us directly. Alternatively, email editorial-team (at) simplywallst.com.
This article by Simply Wall St is general in nature. We provide commentary based on historical data and analyst forecasts only using an unbiased methodology and our articles are not intended to be financial advice. It does not constitute a recommendation to buy or sell any stock, and does not take account of your objectives, or your financial situation. We aim to bring you long-term focused analysis driven by fundamental data. Note that our analysis may not factor in the latest price-sensitive company announcements or qualitative material. Simply Wall St has no position in any stocks mentioned.
Have feedback on this article? Concerned about the content? Get in touch with us directly. Alternatively, email editorial-team@simplywallst.com
