
 Yahoo Finance
 Investing in Harworth Group (LON:HWG) a year ago would have delivered you a 53% gain
These days it's easy to simply buy an index fund, and your returns should (roughly) match the market. But you can significantly boost your returns by picking above-average stocks. To wit, the Harworth Group plc (LON:HWG) share price is 51% higher than it was a year ago, much better than the market return of around 6.3% (not including dividends) in the same period. If it can keep that out-performance up over the long term, investors will do very well! However, the longer term returns haven't been so impressive, with the stock up just 10.0% in the last three years.
Now it's worth having a look at the company's fundamentals too, because that will help us determine if the long term shareholder return has matched the performance of the underlying business.
View our latest analysis for Harworth Group
To quote Buffett, 'Ships will sail around the world but the Flat Earth Society will flourish. There will continue to be wide discrepancies between price and value in the marketplace...' One flawed but reasonable way to assess how sentiment around a company has changed is to compare the earnings per share (EPS) with the share price.
During the last year Harworth Group grew its earnings per share, moving from a loss to a profit.
When a company has just transitioned to profitability, earnings per share growth is not always the best way to look at the share price action.
We are skeptical of the suggestion that the 0.9% dividend yield would entice buyers to the stock. Unfortunately Harworth Group's fell 57% over twelve months. So using a snapshot of key business metrics doesn't give us a good picture of why the market is bidding up the stock.
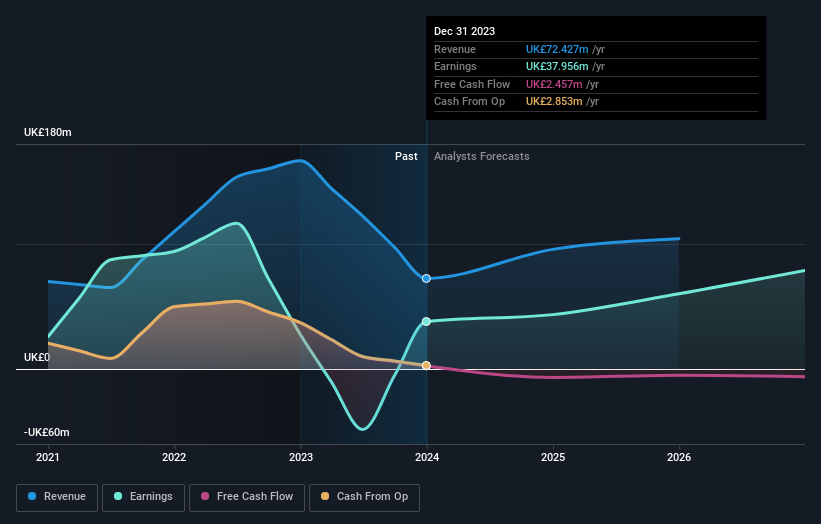
The company's revenue and earnings (over time) are depicted in the image below (click to see the exact numbers).
It's probably worth noting we've seen significant insider buying in the last quarter, which we consider a positive. On the other hand, we think the revenue and earnings trends are much more meaningful measures of the business. If you are thinking of buying or selling Harworth Group stock, you should check out this free report showing analyst profit forecasts.
A Different Perspective
It's nice to see that Harworth Group shareholders have received a total shareholder return of 53% over the last year. Of course, that includes the dividend. That gain is better than the annual TSR over five years, which is 5%. Therefore it seems like sentiment around the company has been positive lately. Someone with an optimistic perspective could view the recent improvement in TSR as indicating that the business itself is getting better with time. I find it very interesting to look at share price over the long term as a proxy for business performance. But to truly gain insight, we need to consider other information, too. For example, we've discovered 1 warning sign for Harworth Group that you should be aware of before investing here.
There are plenty of other companies that have insiders buying up shares. You probably do not want to miss this free list of undervalued small cap companies that insiders are buying.
Please note, the market returns quoted in this article reflect the market weighted average returns of stocks that currently trade on British exchanges.
Have feedback on this article? Concerned about the content? Get in touch with us directly. Alternatively, email editorial-team (at) simplywallst.com.
This article by Simply Wall St is general in nature. We provide commentary based on historical data and analyst forecasts only using an unbiased methodology and our articles are not intended to be financial advice. It does not constitute a recommendation to buy or sell any stock, and does not take account of your objectives, or your financial situation. We aim to bring you long-term focused analysis driven by fundamental data. Note that our analysis may not factor in the latest price-sensitive company announcements or qualitative material. Simply Wall St has no position in any stocks mentioned.
Have feedback on this article? Concerned about the content? Get in touch with us directly. Alternatively, email editorial-team@simplywallst.com
