
 Yahoo Finance
 Investing in Fraser & Neave Holdings Bhd (KLSE:F&N) a year ago would have delivered you a 29% gain
These days it's easy to simply buy an index fund, and your returns should (roughly) match the market. But investors can boost returns by picking market-beating companies to own shares in. To wit, the Fraser & Neave Holdings Bhd (KLSE:F&N) share price is 26% higher than it was a year ago, much better than the market return of around 20% (not including dividends) in the same period. That's a solid performance by our standards! Longer term, the stock is up 21% in three years.
So let's assess the underlying fundamentals over the last 1 year and see if they've moved in lock-step with shareholder returns.
Check out our latest analysis for Fraser & Neave Holdings Bhd
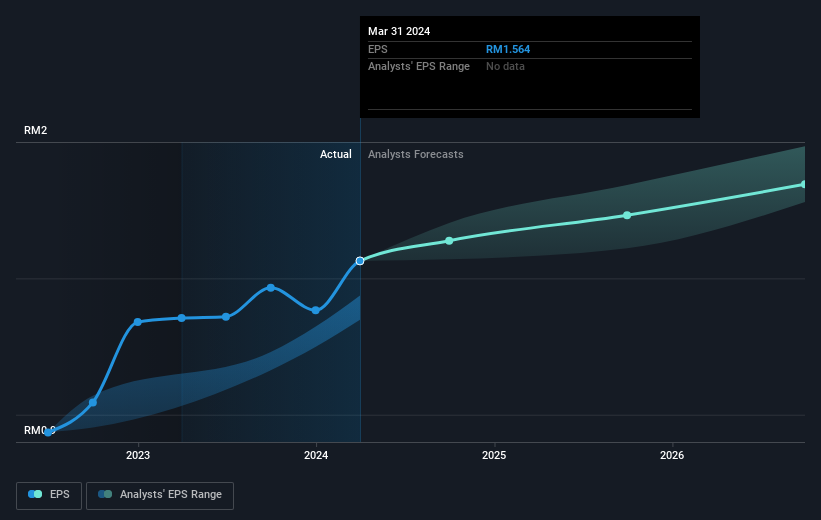
To paraphrase Benjamin Graham: Over the short term the market is a voting machine, but over the long term it's a weighing machine. One flawed but reasonable way to assess how sentiment around a company has changed is to compare the earnings per share (EPS) with the share price.
During the last year Fraser & Neave Holdings Bhd grew its earnings per share (EPS) by 15%. This EPS growth is significantly lower than the 26% increase in the share price. So it's fair to assume the market has a higher opinion of the business than it a year ago.
The image below shows how EPS has tracked over time (if you click on the image you can see greater detail).
We know that Fraser & Neave Holdings Bhd has improved its bottom line lately, but is it going to grow revenue? Check if analysts think Fraser & Neave Holdings Bhd will grow revenue in the future.
What About Dividends?
When looking at investment returns, it is important to consider the difference between total shareholder return (TSR) and share price return. The TSR is a return calculation that accounts for the value of cash dividends (assuming that any dividend received was reinvested) and the calculated value of any discounted capital raisings and spin-offs. So for companies that pay a generous dividend, the TSR is often a lot higher than the share price return. We note that for Fraser & Neave Holdings Bhd the TSR over the last 1 year was 29%, which is better than the share price return mentioned above. This is largely a result of its dividend payments!
A Different Perspective
It's nice to see that Fraser & Neave Holdings Bhd shareholders have received a total shareholder return of 29% over the last year. That's including the dividend. That's better than the annualised return of 0.4% over half a decade, implying that the company is doing better recently. Given the share price momentum remains strong, it might be worth taking a closer look at the stock, lest you miss an opportunity. Is Fraser & Neave Holdings Bhd cheap compared to other companies? These 3 valuation measures might help you decide.
For those who like to find winning investments this free list of undervalued companies with recent insider purchasing, could be just the ticket.
Please note, the market returns quoted in this article reflect the market weighted average returns of stocks that currently trade on Malaysian exchanges.
Have feedback on this article? Concerned about the content? Get in touch with us directly. Alternatively, email editorial-team (at) simplywallst.com.
This article by Simply Wall St is general in nature. We provide commentary based on historical data and analyst forecasts only using an unbiased methodology and our articles are not intended to be financial advice. It does not constitute a recommendation to buy or sell any stock, and does not take account of your objectives, or your financial situation. We aim to bring you long-term focused analysis driven by fundamental data. Note that our analysis may not factor in the latest price-sensitive company announcements or qualitative material. Simply Wall St has no position in any stocks mentioned.
Have feedback on this article? Concerned about the content? Get in touch with us directly. Alternatively, email editorial-team@simplywallst.com
