
 Yahoo Finance
 Investing in discoverIE Group (LON:DSCV) five years ago would have delivered you a 73% gain
When we invest, we're generally looking for stocks that outperform the market average. Buying under-rated businesses is one path to excess returns. For example, the discoverIE Group plc (LON:DSCV) share price is up 62% in the last 5 years, clearly besting the market return of around 6.1% (ignoring dividends).
So let's investigate and see if the longer term performance of the company has been in line with the underlying business' progress.
Check out our latest analysis for discoverIE Group
In his essay The Superinvestors of Graham-and-Doddsville Warren Buffett described how share prices do not always rationally reflect the value of a business. By comparing earnings per share (EPS) and share price changes over time, we can get a feel for how investor attitudes to a company have morphed over time.
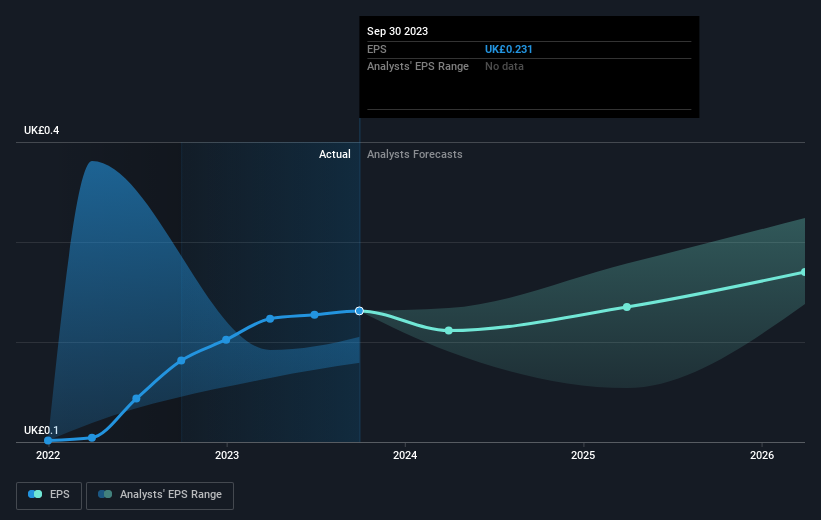
Over half a decade, discoverIE Group managed to grow its earnings per share at 8.4% a year. So the EPS growth rate is rather close to the annualized share price gain of 10% per year. That suggests that the market sentiment around the company hasn't changed much over that time. Indeed, it would appear the share price is reacting to the EPS.
You can see how EPS has changed over time in the image below (click on the chart to see the exact values).
We consider it positive that insiders have made significant purchases in the last year. Even so, future earnings will be far more important to whether current shareholders make money. This free interactive report on discoverIE Group's earnings, revenue and cash flow is a great place to start, if you want to investigate the stock further.
What About Dividends?
As well as measuring the share price return, investors should also consider the total shareholder return (TSR). The TSR incorporates the value of any spin-offs or discounted capital raisings, along with any dividends, based on the assumption that the dividends are reinvested. Arguably, the TSR gives a more comprehensive picture of the return generated by a stock. In the case of discoverIE Group, it has a TSR of 73% for the last 5 years. That exceeds its share price return that we previously mentioned. The dividends paid by the company have thusly boosted the total shareholder return.
A Different Perspective
Investors in discoverIE Group had a tough year, with a total loss of 7.9% (including dividends), against a market gain of about 11%. However, keep in mind that even the best stocks will sometimes underperform the market over a twelve month period. Longer term investors wouldn't be so upset, since they would have made 12%, each year, over five years. It could be that the recent sell-off is an opportunity, so it may be worth checking the fundamental data for signs of a long term growth trend. It is all well and good that insiders have been buying shares, but we suggest you check here to see what price insiders were buying at.
discoverIE Group is not the only stock insiders are buying. So take a peek at this free list of small cap companies at attractive valuations which insiders have been buying.
Please note, the market returns quoted in this article reflect the market weighted average returns of stocks that currently trade on British exchanges.
Have feedback on this article? Concerned about the content? Get in touch with us directly. Alternatively, email editorial-team (at) simplywallst.com.
This article by Simply Wall St is general in nature. We provide commentary based on historical data and analyst forecasts only using an unbiased methodology and our articles are not intended to be financial advice. It does not constitute a recommendation to buy or sell any stock, and does not take account of your objectives, or your financial situation. We aim to bring you long-term focused analysis driven by fundamental data. Note that our analysis may not factor in the latest price-sensitive company announcements or qualitative material. Simply Wall St has no position in any stocks mentioned.
