
 Yahoo Finance
 Investing in Dis-Chem Pharmacies (JSE:DCP) three years ago would have delivered you a 49% gain
By buying an index fund, you can roughly match the market return with ease. But many of us dare to dream of bigger returns, and build a portfolio ourselves. For example, the Dis-Chem Pharmacies Limited (JSE:DCP) share price is up 42% in the last three years, clearly besting the market return of around 18% (not including dividends). However, more recent returns haven't been as impressive as that, with the stock returning just 4.6% in the last year , including dividends .
With that in mind, it's worth seeing if the company's underlying fundamentals have been the driver of long term performance, or if there are some discrepancies.
View our latest analysis for Dis-Chem Pharmacies
In his essay The Superinvestors of Graham-and-Doddsville Warren Buffett described how share prices do not always rationally reflect the value of a business. One way to examine how market sentiment has changed over time is to look at the interaction between a company's share price and its earnings per share (EPS).
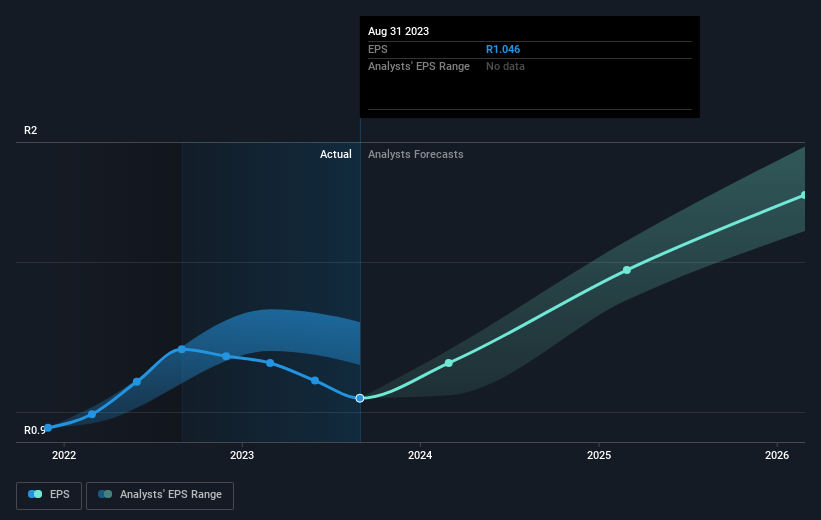
Dis-Chem Pharmacies was able to grow its EPS at 12% per year over three years, sending the share price higher. This EPS growth is remarkably close to the 12% average annual increase in the share price. This suggests that sentiment and expectations have not changed drastically. Quite to the contrary, the share price has arguably reflected the EPS growth.
You can see how EPS has changed over time in the image below (click on the chart to see the exact values).
It might be well worthwhile taking a look at our free report on Dis-Chem Pharmacies' earnings, revenue and cash flow.
What About Dividends?
It is important to consider the total shareholder return, as well as the share price return, for any given stock. Whereas the share price return only reflects the change in the share price, the TSR includes the value of dividends (assuming they were reinvested) and the benefit of any discounted capital raising or spin-off. Arguably, the TSR gives a more comprehensive picture of the return generated by a stock. In the case of Dis-Chem Pharmacies, it has a TSR of 49% for the last 3 years. That exceeds its share price return that we previously mentioned. The dividends paid by the company have thusly boosted the total shareholder return.
A Different Perspective
Dis-Chem Pharmacies provided a TSR of 4.6% over the last twelve months. But that return falls short of the market. On the bright side, that's still a gain, and it's actually better than the average return of 2% over half a decade This suggests the company might be improving over time. Before spending more time on Dis-Chem Pharmacies it might be wise to click here to see if insiders have been buying or selling shares.
If you like to buy stocks alongside management, then you might just love this free list of companies. (Hint: insiders have been buying them).
Please note, the market returns quoted in this article reflect the market weighted average returns of stocks that currently trade on South African exchanges.
Have feedback on this article? Concerned about the content? Get in touch with us directly. Alternatively, email editorial-team (at) simplywallst.com.
This article by Simply Wall St is general in nature. We provide commentary based on historical data and analyst forecasts only using an unbiased methodology and our articles are not intended to be financial advice. It does not constitute a recommendation to buy or sell any stock, and does not take account of your objectives, or your financial situation. We aim to bring you long-term focused analysis driven by fundamental data. Note that our analysis may not factor in the latest price-sensitive company announcements or qualitative material. Simply Wall St has no position in any stocks mentioned.
