
 Yahoo Finance
 Insider-Owned Growth Companies To Watch In June 2024
As global markets continue to navigate through a landscape marked by modest equity gains and shifting economic indicators, investors remain attentive to opportunities that align with these evolving conditions. High insider ownership in growth companies often signals strong confidence from those who know the business best, making such stocks particularly interesting in the current environment where discerning stability and potential is key.
Top 10 Growth Companies With High Insider Ownership
Name | Insider Ownership | Earnings Growth |
Zhejiang Jolly PharmaceuticalLTD (SZSE:300181) | 24% | 22.3% |
Archean Chemical Industries (NSEI:ACI) | 22.9% | 28.9% |
Gaming Innovation Group (OB:GIG) | 20.2% | 36.2% |
Fine M-TecLTD (KOSDAQ:A441270) | 17.3% | 36.4% |
HANA Micron (KOSDAQ:A067310) | 20% | 93.4% |
Credo Technology Group Holding (NasdaqGS:CRDO) | 14.8% | 84.4% |
UTI (KOSDAQ:A179900) | 34.1% | 122.7% |
EHang Holdings (NasdaqGM:EH) | 32.8% | 74.3% |
Vow (OB:VOW) | 31.8% | 97.6% |
OSE Immunotherapeutics (ENXTPA:OSE) | 25.6% | 79.3% |
Let's uncover some gems from our specialized screener.
MBC Group
Simply Wall St Growth Rating: ★★★★☆☆
Overview: MBC Group is a media company with operations in the United Arab Emirates, Saudi Arabia, Egypt, Iraq, North Africa, and internationally, boasting a market capitalization of SAR 14.20 billion.
Operations: The company generates revenue through its extensive media operations across the United Arab Emirates, Saudi Arabia, Egypt, Iraq, North Africa, and on an international scale.
Insider Ownership: 36%
Revenue Growth Forecast: 13.8% p.a.
MBC Group, a key player in the media sector, recently enhanced its leadership by appointing Samar Akrouk as Managing Director of MBC Studios. This move aligns with its strategy to expand globally amid growing demand for non-English content. Despite high insider ownership and significant earnings growth forecasted at 47.7% annually, MBC's revenue growth is moderate at 13.8% per year, slightly above the SA market average. However, its projected Return on Equity remains low at 9.4%.

Zhejiang Huace Film & TV
Simply Wall St Growth Rating: ★★★★★☆
Overview: Zhejiang Huace Film & TV Co., Ltd. specializes in the production and distribution of film and television dramas both domestically and internationally, with a market capitalization of approximately CN¥10.79 billion.
Operations: The company generates revenue primarily through the production and distribution of film and television content.
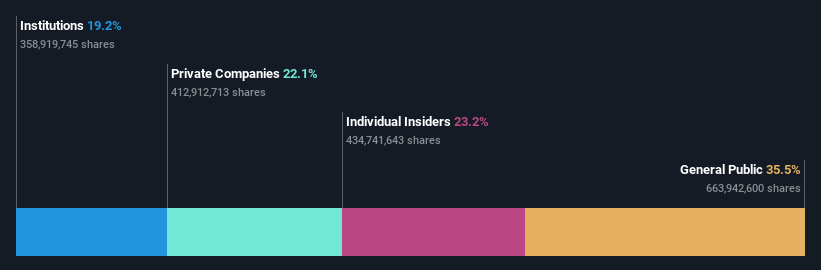
Insider Ownership: 23.2%
Revenue Growth Forecast: 26.7% p.a.
Zhejiang Huace Film & TV, despite its recent dividend increases, faces challenges with a significant drop in quarterly and annual sales and net income. The company's share price has been highly volatile over the past three months. However, it is expected to see substantial earnings growth of 27.4% annually over the next three years, outpacing the Chinese market forecast of 22.2%. Revenue growth is also projected to exceed market expectations at 26.7% annually.
Auras Technology
Simply Wall St Growth Rating: ★★★★★★
Overview: Auras Technology Co., Ltd. operates in the manufacturing, processing, and retailing of electronic materials and computer heat dissipation modules across regions including China, Taiwan, Korea, and Ireland, with a market capitalization of approximately NT$66.74 billion.
Operations: The company generates NT$12.58 billion in revenue from its electronic components and parts segment.
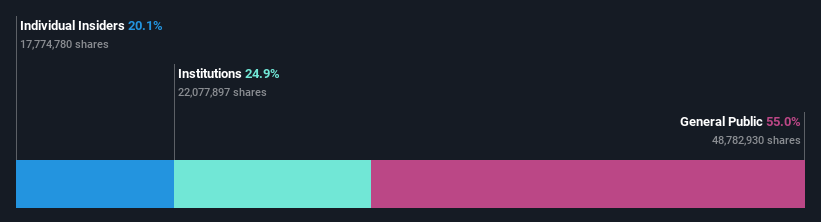
Insider Ownership: 20.1%
Revenue Growth Forecast: 25.5% p.a.
Auras Technology has experienced a recent uptick in earnings, with a notable 8.3% growth over the past year and forecasts predicting a robust 30% annual increase in earnings and 25.5% in revenue, outpacing the TW market's expectations. Despite this positive trajectory, shareholder dilution occurred last year, and the company's share price has shown high volatility recently. Additionally, significant amendments to its charter and board restructuring were approved at its latest AGM, reflecting ongoing governance adjustments.
Summing It All Up
Click here to access our complete index of 1454 Fast Growing Companies With High Insider Ownership.
Already own these companies? Link your portfolio to Simply Wall St and get alerts on any new warning signs to your stocks.
Streamline your investment strategy with Simply Wall St's app for free and benefit from extensive research on stocks across all corners of the world.
Ready For A Different Approach?
Explore high-performing small cap companies that haven't yet garnered significant analyst attention.
Diversify your portfolio with solid dividend payers offering reliable income streams to weather potential market turbulence.
Find companies with promising cash flow potential yet trading below their fair value.
This article by Simply Wall St is general in nature. We provide commentary based on historical data and analyst forecasts only using an unbiased methodology and our articles are not intended to be financial advice. It does not constitute a recommendation to buy or sell any stock, and does not take account of your objectives, or your financial situation. We aim to bring you long-term focused analysis driven by fundamental data. Note that our analysis may not factor in the latest price-sensitive company announcements or qualitative material. Simply Wall St has no position in any stocks mentioned.The analysis only considers stock directly held by insiders. It does not include indirectly owned stock through other vehicles such as corporate and/or trust entities. All forecast revenue and earnings growth rates quoted are in terms of annualised (per annum) growth rates over 1-3 years.
Companies discussed in this article include SASE:4072SZSE:300133 and TPEX:3324
Have feedback on this article? Concerned about the content? Get in touch with us directly. Alternatively, email editorial-team@simplywallst.com
