
 Yahoo Finance
 Housing ETFs in Focus as Spring Selling Falters: What Awaits?
Sales of existing homes (the lion’s share of the U.S. housing market) dropped for the third month in a row in May, highlighting continued affordability challenges that stalled the key spring selling season this year. Sales of new single-family houses in the United States fell 11.3% sequentially in May 2024.
The spring selling season is considered the peak time for home sellers. Normally, the season starts in March and lasts through May-June, thanks to warmer weather after a chilly winter and buyers’ inclination to move to a new house before the next school calendar starts. Otherwise, winter months normally remain subdued for home building as the weather is too wet in the south and severely chilly in the north.
Per experts, about 40% of home sales take place between April and July in the United States. However, this year, SPDR S&P Homebuilders ETF XHB and iShares US Home Construction ETF ITB have lost 8.3% and 11% since Apr (as of Jun 27, 2024). Higher mortgage rates and home prices have weighed on home sales.
Record-High Prices
The ongoing shortage of homes has kept prices elevated. The median sales price rose by 5.8% year over year, driven by more sales of high-priced properties and multiple offers. NAR Chief Economist Lawrence Yun noted that record-high home prices are widening the gap between current homeowners and potential first-time buyers.
Delayed Recovery
While mortgage rates have softened slightly, the Fed is not likely to cut interest rates until later this year. Yun suggested that this delay might be deferring the recovery of home sales, which have hovered around a 4 million annualized rate over the past year. At the current sales pace, it would take 3.7 months to sell all homes on the market, the highest duration in four years.
Any Ray of Hope?
Yun expects increased inventory to eventually boost home sales in the coming months. The supply of existing homes on the market increased 18.5% year over year, totaling 1.28 million homes, partly because homeowners who were waiting for mortgage rates to fall have finally decided to list their properties. Despite this increase, the inventory remains below pre-pandemic levels when mortgage rates were significantly lower.
When Will We See a Fed Rate Cut?
The recent inflation and retail sales data has ignited market expectations of interest rate cuts this year, with a likelihood of 56.3% that the Fed might lower the rate to 5%-5.25% in September, according to the CME FedWatch Tool. And there is a probability of 42.1% that the Fed might cut the rate to 4.75-5.00% in December.
Compelling Valuation
The homebuilding industry trades at a forward P/E of 8.22X versus 18.25X P/E possessed by the S&P 500 ETF IVV. The price-to-book ratio of the industry is also favorable at 1.31 versus 3.85 held by IVV. Price-to-sales ratio of the industry is also favorable at 0.92 compared to IVV's ratio of 2.70.
Sound Financial Prospects
The projected EPS growth of the sector is 6.61% in line with IVV, while historical EPS growth was 33.61% versus 9.87% growth of IVV. The homebuilding industry’s historical sales growth (12.29%) was also higher than IVV (9.87%).
The industry's return on asset is 10.60 times compared to IVV's return on asset of 6.84 times. Homebuilders’ return on investment is 14.41 times compared to IVV's return on investment of 10.94 times.
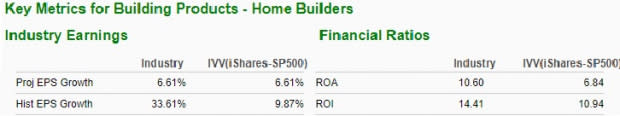
Image Source: Zacks Investment Research
Upbeat Industry and Sector Ranks
The Zacks Building Products - Home Builders industry contains many of these stocks and currently ranks in the top 30% out of approximately 250 industries. Because it is ranked in the top half of all Zacks Ranked Industries, we expect this group to outperform over the next 3 to 6 months. This group has been subdued this year with just 0.2% gains but could gain ahead due to cheaper valuation and the possibility of moderate easing in interest rates.
Quantitative research studies suggest that about half of a stock’s future price appreciation is due to its industry grouping. In fact, the top 50% of Zacks Ranked Industries outperforms the bottom 50% by a factor of more than 2 to 1. Not only upbeat industry rank, homebuilders hail from an upbeat Zacks Construction sector, which ranks in the top 25% out of approximately 16 sectors. The space is up 4.5% in the year-to-date frame.
Want the latest recommendations from Zacks Investment Research? Today, you can download 7 Best Stocks for the Next 30 Days. Click to get this free report
SPDR S&P Homebuilders ETF (XHB): ETF Research Reports
iShares U.S. Home Construction ETF (ITB): ETF Research Reports
iShares Core S&P 500 ETF (IVV): ETF Research Reports
