
 Yahoo Finance
 Hongli Group Inc. (NASDAQ:HLP) Stock Is Going Strong But Fundamentals Look Uncertain: What Lies Ahead ?
Hongli Group (NASDAQ:HLP) has had a great run on the share market with its stock up by a significant 34% over the last three months. But the company's key financial indicators appear to be differing across the board and that makes us question whether or not the company's current share price momentum can be maintained. In this article, we decided to focus on Hongli Group's ROE.
ROE or return on equity is a useful tool to assess how effectively a company can generate returns on the investment it received from its shareholders. Put another way, it reveals the company's success at turning shareholder investments into profits.
Check out our latest analysis for Hongli Group
How Is ROE Calculated?
The formula for return on equity is:
Return on Equity = Net Profit (from continuing operations) ÷ Shareholders' Equity
So, based on the above formula, the ROE for Hongli Group is:
9.0% = US$1.9m ÷ US$21m (Based on the trailing twelve months to June 2023).
The 'return' is the income the business earned over the last year. Another way to think of that is that for every $1 worth of equity, the company was able to earn $0.09 in profit.
What Has ROE Got To Do With Earnings Growth?
So far, we've learned that ROE is a measure of a company's profitability. We now need to evaluate how much profit the company reinvests or "retains" for future growth which then gives us an idea about the growth potential of the company. Assuming everything else remains unchanged, the higher the ROE and profit retention, the higher the growth rate of a company compared to companies that don't necessarily bear these characteristics.
A Side By Side comparison of Hongli Group's Earnings Growth And 9.0% ROE
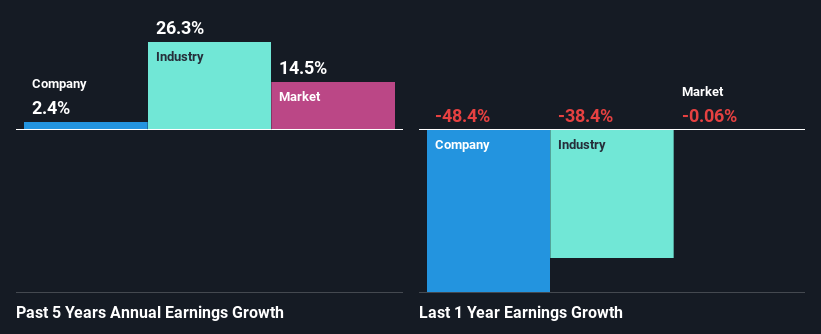
At first glance, Hongli Group's ROE doesn't look very promising. However, given that the company's ROE is similar to the average industry ROE of 11%, we may spare it some thought. Having said that, Hongli Group has shown a meagre net income growth of 2.4% over the past five years. Remember, the company's ROE is not particularly great to begin with. So this could also be one of the reasons behind the company's low growth in earnings.
We then compared Hongli Group's net income growth with the industry and found that the company's growth figure is lower than the average industry growth rate of 26% in the same 5-year period, which is a bit concerning.
Earnings growth is a huge factor in stock valuation. It’s important for an investor to know whether the market has priced in the company's expected earnings growth (or decline). This then helps them determine if the stock is placed for a bright or bleak future. One good indicator of expected earnings growth is the P/E ratio which determines the price the market is willing to pay for a stock based on its earnings prospects. So, you may want to check if Hongli Group is trading on a high P/E or a low P/E, relative to its industry.
Is Hongli Group Efficiently Re-investing Its Profits?
Hongli Group doesn't pay any dividend, meaning that potentially all of its profits are being reinvested in the business. This doesn't explain the low earnings growth number that we discussed above. Therefore, there might be some other reasons to explain the lack in that respect. For example, the business could be in decline.
Summary
Overall, we have mixed feelings about Hongli Group. While the company does have a high rate of profit retention, its low rate of return is probably hampering its earnings growth. Wrapping up, we would proceed with caution with this company and one way of doing that would be to look at the risk profile of the business. Our risks dashboard would have the 4 risks we have identified for Hongli Group.
Have feedback on this article? Concerned about the content? Get in touch with us directly. Alternatively, email editorial-team (at) simplywallst.com.
This article by Simply Wall St is general in nature. We provide commentary based on historical data and analyst forecasts only using an unbiased methodology and our articles are not intended to be financial advice. It does not constitute a recommendation to buy or sell any stock, and does not take account of your objectives, or your financial situation. We aim to bring you long-term focused analysis driven by fundamental data. Note that our analysis may not factor in the latest price-sensitive company announcements or qualitative material. Simply Wall St has no position in any stocks mentioned.
