
 Yahoo Finance
 Here's What's Concerning About Y&G Corporation Bhd's (KLSE:Y&G) Returns On Capital
If you're looking for a multi-bagger, there's a few things to keep an eye out for. In a perfect world, we'd like to see a company investing more capital into its business and ideally the returns earned from that capital are also increasing. Ultimately, this demonstrates that it's a business that is reinvesting profits at increasing rates of return. Although, when we looked at Y&G Corporation Bhd (KLSE:Y&G), it didn't seem to tick all of these boxes.
Understanding Return On Capital Employed (ROCE)
If you haven't worked with ROCE before, it measures the 'return' (pre-tax profit) a company generates from capital employed in its business. To calculate this metric for Y&G Corporation Bhd, this is the formula:
Return on Capital Employed = Earnings Before Interest and Tax (EBIT) ÷ (Total Assets - Current Liabilities)
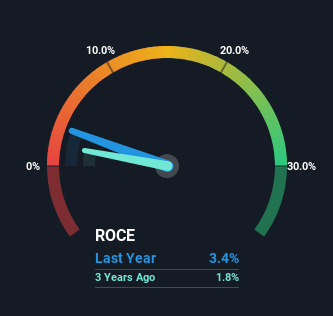
0.034 = RM13m ÷ (RM403m - RM31m) (Based on the trailing twelve months to March 2024).
Thus, Y&G Corporation Bhd has an ROCE of 3.4%. In absolute terms, that's a low return and it also under-performs the Construction industry average of 8.6%.
See our latest analysis for Y&G Corporation Bhd
While the past is not representative of the future, it can be helpful to know how a company has performed historically, which is why we have this chart above. If you're interested in investigating Y&G Corporation Bhd's past further, check out this free graph covering Y&G Corporation Bhd's past earnings, revenue and cash flow.
So How Is Y&G Corporation Bhd's ROCE Trending?
In terms of Y&G Corporation Bhd's historical ROCE movements, the trend isn't fantastic. Over the last five years, returns on capital have decreased to 3.4% from 4.5% five years ago. Given the business is employing more capital while revenue has slipped, this is a bit concerning. This could mean that the business is losing its competitive advantage or market share, because while more money is being put into ventures, it's actually producing a lower return - "less bang for their buck" per se.
The Bottom Line
From the above analysis, we find it rather worrisome that returns on capital and sales for Y&G Corporation Bhd have fallen, meanwhile the business is employing more capital than it was five years ago. Long term shareholders who've owned the stock over the last three years have experienced a 30% depreciation in their investment, so it appears the market might not like these trends either. With underlying trends that aren't great in these areas, we'd consider looking elsewhere.
Y&G Corporation Bhd does have some risks though, and we've spotted 1 warning sign for Y&G Corporation Bhd that you might be interested in.
For those who like to invest in solid companies, check out this free list of companies with solid balance sheets and high returns on equity.
Have feedback on this article? Concerned about the content? Get in touch with us directly. Alternatively, email editorial-team (at) simplywallst.com.
This article by Simply Wall St is general in nature. We provide commentary based on historical data and analyst forecasts only using an unbiased methodology and our articles are not intended to be financial advice. It does not constitute a recommendation to buy or sell any stock, and does not take account of your objectives, or your financial situation. We aim to bring you long-term focused analysis driven by fundamental data. Note that our analysis may not factor in the latest price-sensitive company announcements or qualitative material. Simply Wall St has no position in any stocks mentioned.
Have feedback on this article? Concerned about the content? Get in touch with us directly. Alternatively, email editorial-team@simplywallst.com
