
 Yahoo Finance
 Here's What's Concerning About Paul Hartmann's (FRA:PHH2) Returns On Capital
What trends should we look for it we want to identify stocks that can multiply in value over the long term? Firstly, we'll want to see a proven return on capital employed (ROCE) that is increasing, and secondly, an expanding base of capital employed. Put simply, these types of businesses are compounding machines, meaning they are continually reinvesting their earnings at ever-higher rates of return. In light of that, when we looked at Paul Hartmann (FRA:PHH2) and its ROCE trend, we weren't exactly thrilled.
Understanding Return On Capital Employed (ROCE)
Just to clarify if you're unsure, ROCE is a metric for evaluating how much pre-tax income (in percentage terms) a company earns on the capital invested in its business. Analysts use this formula to calculate it for Paul Hartmann:
Return on Capital Employed = Earnings Before Interest and Tax (EBIT) ÷ (Total Assets - Current Liabilities)
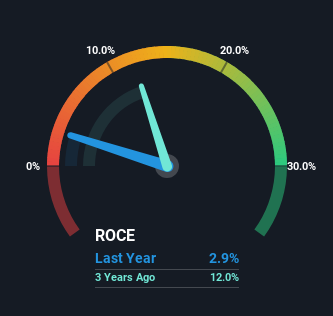
0.029 = €44m ÷ (€2.0b - €488m) (Based on the trailing twelve months to June 2023).
Thus, Paul Hartmann has an ROCE of 2.9%. Ultimately, that's a low return and it under-performs the Medical Equipment industry average of 6.6%.
Check out our latest analysis for Paul Hartmann
While the past is not representative of the future, it can be helpful to know how a company has performed historically, which is why we have this chart above. If you're interested in investigating Paul Hartmann's past further, check out this free graph covering Paul Hartmann's past earnings, revenue and cash flow.
What The Trend Of ROCE Can Tell Us
In terms of Paul Hartmann's historical ROCE movements, the trend isn't fantastic. Over the last five years, returns on capital have decreased to 2.9% from 12% five years ago. On the other hand, the company has been employing more capital without a corresponding improvement in sales in the last year, which could suggest these investments are longer term plays. It may take some time before the company starts to see any change in earnings from these investments.
Our Take On Paul Hartmann's ROCE
Bringing it all together, while we're somewhat encouraged by Paul Hartmann's reinvestment in its own business, we're aware that returns are shrinking. And investors appear hesitant that the trends will pick up because the stock has fallen 21% in the last five years. In any case, the stock doesn't have these traits of a multi-bagger discussed above, so if that's what you're looking for, we think you'd have more luck elsewhere.
If you'd like to know more about Paul Hartmann, we've spotted 3 warning signs, and 2 of them make us uncomfortable.
While Paul Hartmann isn't earning the highest return, check out this free list of companies that are earning high returns on equity with solid balance sheets.
Have feedback on this article? Concerned about the content? Get in touch with us directly. Alternatively, email editorial-team (at) simplywallst.com.
This article by Simply Wall St is general in nature. We provide commentary based on historical data and analyst forecasts only using an unbiased methodology and our articles are not intended to be financial advice. It does not constitute a recommendation to buy or sell any stock, and does not take account of your objectives, or your financial situation. We aim to bring you long-term focused analysis driven by fundamental data. Note that our analysis may not factor in the latest price-sensitive company announcements or qualitative material. Simply Wall St has no position in any stocks mentioned.
