
 Yahoo Finance
 Here's What's Concerning About PageGroup's (LON:PAGE) Returns On Capital
Ignoring the stock price of a company, what are the underlying trends that tell us a business is past the growth phase? Typically, we'll see the trend of both return on capital employed (ROCE) declining and this usually coincides with a decreasing amount of capital employed. Ultimately this means that the company is earning less per dollar invested and on top of that, it's shrinking its base of capital employed. So after glancing at the trends within PageGroup (LON:PAGE), we weren't too hopeful.
What Is Return On Capital Employed (ROCE)?
If you haven't worked with ROCE before, it measures the 'return' (pre-tax profit) a company generates from capital employed in its business. To calculate this metric for PageGroup, this is the formula:
Return on Capital Employed = Earnings Before Interest and Tax (EBIT) ÷ (Total Assets - Current Liabilities)
0.30 = UK£119m ÷ (UK£705m - UK£302m) (Based on the trailing twelve months to December 2023).
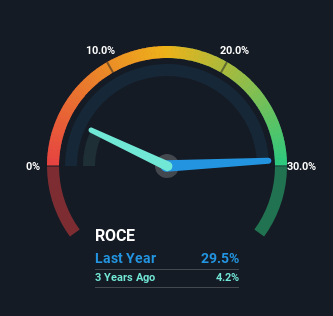
Therefore, PageGroup has an ROCE of 30%. That's a fantastic return and not only that, it outpaces the average of 18% earned by companies in a similar industry.
View our latest analysis for PageGroup
In the above chart we have measured PageGroup's prior ROCE against its prior performance, but the future is arguably more important. If you're interested, you can view the analysts predictions in our free analyst report for PageGroup .
What Does the ROCE Trend For PageGroup Tell Us?
In terms of PageGroup's historical ROCE movements, the trend doesn't inspire confidence. Unfortunately the returns on capital have diminished from the 42% that they were earning five years ago. On top of that, it's worth noting that the amount of capital employed within the business has remained relatively steady. Since returns are falling and the business has the same amount of assets employed, this can suggest it's a mature business that hasn't had much growth in the last five years. So because these trends aren't typically conducive to creating a multi-bagger, we wouldn't hold our breath on PageGroup becoming one if things continue as they have.
On a side note, PageGroup's current liabilities are still rather high at 43% of total assets. This effectively means that suppliers (or short-term creditors) are funding a large portion of the business, so just be aware that this can introduce some elements of risk. Ideally we'd like to see this reduce as that would mean fewer obligations bearing risks.
The Key Takeaway
In summary, it's unfortunate that PageGroup is generating lower returns from the same amount of capital. Despite the concerning underlying trends, the stock has actually gained 9.6% over the last five years, so it might be that the investors are expecting the trends to reverse. Regardless, we don't like the trends as they are and if they persist, we think you might find better investments elsewhere.
On a separate note, we've found 2 warning signs for PageGroup you'll probably want to know about.
If you'd like to see other companies earning high returns, check out our free list of companies earning high returns with solid balance sheets here.
Have feedback on this article? Concerned about the content? Get in touch with us directly. Alternatively, email editorial-team (at) simplywallst.com.
This article by Simply Wall St is general in nature. We provide commentary based on historical data and analyst forecasts only using an unbiased methodology and our articles are not intended to be financial advice. It does not constitute a recommendation to buy or sell any stock, and does not take account of your objectives, or your financial situation. We aim to bring you long-term focused analysis driven by fundamental data. Note that our analysis may not factor in the latest price-sensitive company announcements or qualitative material. Simply Wall St has no position in any stocks mentioned.
Have feedback on this article? Concerned about the content? Get in touch with us directly. Alternatively, email editorial-team@simplywallst.com
