
 Yahoo Finance
 Here's What To Make Of WashTec's (ETR:WSU) Decelerating Rates Of Return
If you're not sure where to start when looking for the next multi-bagger, there are a few key trends you should keep an eye out for. One common approach is to try and find a company with returns on capital employed (ROCE) that are increasing, in conjunction with a growing amount of capital employed. Put simply, these types of businesses are compounding machines, meaning they are continually reinvesting their earnings at ever-higher rates of return. So when we looked at WashTec (ETR:WSU), they do have a high ROCE, but we weren't exactly elated from how returns are trending.
What Is Return On Capital Employed (ROCE)?
For those that aren't sure what ROCE is, it measures the amount of pre-tax profits a company can generate from the capital employed in its business. Analysts use this formula to calculate it for WashTec:
Return on Capital Employed = Earnings Before Interest and Tax (EBIT) ÷ (Total Assets - Current Liabilities)
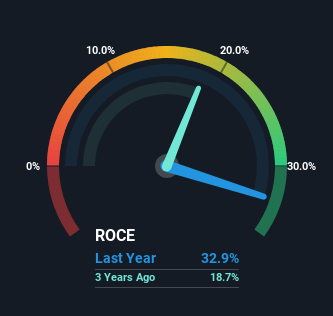
0.33 = €39m ÷ (€263m - €145m) (Based on the trailing twelve months to March 2024).
So, WashTec has an ROCE of 33%. That's a fantastic return and not only that, it outpaces the average of 11% earned by companies in a similar industry.
Check out our latest analysis for WashTec
In the above chart we have measured WashTec's prior ROCE against its prior performance, but the future is arguably more important. If you'd like to see what analysts are forecasting going forward, you should check out our free analyst report for WashTec .
The Trend Of ROCE
Over the past five years, WashTec's ROCE and capital employed have both remained mostly flat. This tells us the company isn't reinvesting in itself, so it's plausible that it's past the growth phase. So it may not be a multi-bagger in the making, but given the decent 33% return on capital, it'd be difficult to find fault with the business's current operations. That being the case, it makes sense that WashTec has been paying out 85% of its earnings to its shareholders. Most shareholders probably know this and own the stock for its dividend.
Another thing to note, WashTec has a high ratio of current liabilities to total assets of 55%. This effectively means that suppliers (or short-term creditors) are funding a large portion of the business, so just be aware that this can introduce some elements of risk. While it's not necessarily a bad thing, it can be beneficial if this ratio is lower.
Our Take On WashTec's ROCE
In summary, WashTec isn't compounding its earnings but is generating decent returns on the same amount of capital employed. And investors appear hesitant that the trends will pick up because the stock has fallen 13% in the last five years. Therefore based on the analysis done in this article, we don't think WashTec has the makings of a multi-bagger.
One more thing, we've spotted 1 warning sign facing WashTec that you might find interesting.
If you'd like to see other companies earning high returns, check out our free list of companies earning high returns with solid balance sheets here.
Have feedback on this article? Concerned about the content? Get in touch with us directly. Alternatively, email editorial-team (at) simplywallst.com.
This article by Simply Wall St is general in nature. We provide commentary based on historical data and analyst forecasts only using an unbiased methodology and our articles are not intended to be financial advice. It does not constitute a recommendation to buy or sell any stock, and does not take account of your objectives, or your financial situation. We aim to bring you long-term focused analysis driven by fundamental data. Note that our analysis may not factor in the latest price-sensitive company announcements or qualitative material. Simply Wall St has no position in any stocks mentioned.
