
 Yahoo Finance
 Here's What To Make Of Domain Holdings Australia's (ASX:DHG) Decelerating Rates Of Return
There are a few key trends to look for if we want to identify the next multi-bagger. One common approach is to try and find a company with returns on capital employed (ROCE) that are increasing, in conjunction with a growing amount of capital employed. If you see this, it typically means it's a company with a great business model and plenty of profitable reinvestment opportunities. In light of that, when we looked at Domain Holdings Australia (ASX:DHG) and its ROCE trend, we weren't exactly thrilled.
Understanding Return On Capital Employed (ROCE)
For those that aren't sure what ROCE is, it measures the amount of pre-tax profits a company can generate from the capital employed in its business. Analysts use this formula to calculate it for Domain Holdings Australia:
Return on Capital Employed = Earnings Before Interest and Tax (EBIT) ÷ (Total Assets - Current Liabilities)
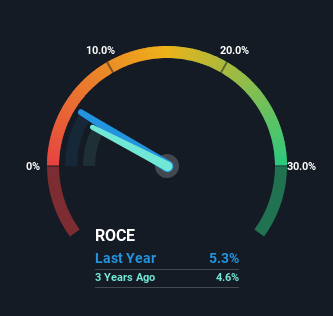
0.053 = AU$76m ÷ (AU$1.5b - AU$53m) (Based on the trailing twelve months to December 2023).
Thus, Domain Holdings Australia has an ROCE of 5.3%. Ultimately, that's a low return and it under-performs the Interactive Media and Services industry average of 8.0%.
View our latest analysis for Domain Holdings Australia
In the above chart we have measured Domain Holdings Australia's prior ROCE against its prior performance, but the future is arguably more important. If you'd like, you can check out the forecasts from the analysts covering Domain Holdings Australia for free.
What Does the ROCE Trend For Domain Holdings Australia Tell Us?
There hasn't been much to report for Domain Holdings Australia's returns and its level of capital employed because both metrics have been steady for the past five years. Businesses with these traits tend to be mature and steady operations because they're past the growth phase. So don't be surprised if Domain Holdings Australia doesn't end up being a multi-bagger in a few years time. On top of that you'll notice that Domain Holdings Australia has been paying out a large portion (66%) of earnings in the form of dividends to shareholders. These mature businesses typically have reliable earnings and not many places to reinvest them, so the next best option is to put the earnings into shareholders pockets.
The Key Takeaway
In summary, Domain Holdings Australia isn't compounding its earnings but is generating stable returns on the same amount of capital employed. And investors may be recognizing these trends since the stock has only returned a total of 3.4% to shareholders over the last five years. As a result, if you're hunting for a multi-bagger, we think you'd have more luck elsewhere.
If you're still interested in Domain Holdings Australia it's worth checking out our FREE intrinsic value approximation for DHG to see if it's trading at an attractive price in other respects.
While Domain Holdings Australia may not currently earn the highest returns, we've compiled a list of companies that currently earn more than 25% return on equity. Check out this free list here.
Have feedback on this article? Concerned about the content? Get in touch with us directly. Alternatively, email editorial-team (at) simplywallst.com.
This article by Simply Wall St is general in nature. We provide commentary based on historical data and analyst forecasts only using an unbiased methodology and our articles are not intended to be financial advice. It does not constitute a recommendation to buy or sell any stock, and does not take account of your objectives, or your financial situation. We aim to bring you long-term focused analysis driven by fundamental data. Note that our analysis may not factor in the latest price-sensitive company announcements or qualitative material. Simply Wall St has no position in any stocks mentioned.
Have feedback on this article? Concerned about the content? Get in touch with us directly. Alternatively, email editorial-team@simplywallst.com
