
 Yahoo Finance
 GLOBALFOUNDRIES (NASDAQ:GFS) Shareholders Will Want The ROCE Trajectory To Continue
If you're looking for a multi-bagger, there's a few things to keep an eye out for. One common approach is to try and find a company with returns on capital employed (ROCE) that are increasing, in conjunction with a growing amount of capital employed. Put simply, these types of businesses are compounding machines, meaning they are continually reinvesting their earnings at ever-higher rates of return. So on that note, GLOBALFOUNDRIES (NASDAQ:GFS) looks quite promising in regards to its trends of return on capital.
Understanding Return On Capital Employed (ROCE)
Just to clarify if you're unsure, ROCE is a metric for evaluating how much pre-tax income (in percentage terms) a company earns on the capital invested in its business. Analysts use this formula to calculate it for GLOBALFOUNDRIES:
Return on Capital Employed = Earnings Before Interest and Tax (EBIT) ÷ (Total Assets - Current Liabilities)
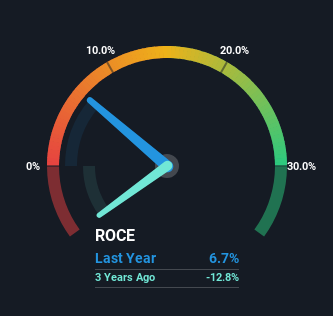
0.067 = US$1.1b ÷ (US$18b - US$2.9b) (Based on the trailing twelve months to March 2024).
Therefore, GLOBALFOUNDRIES has an ROCE of 6.7%. In absolute terms, that's a low return and it also under-performs the Semiconductor industry average of 9.7%.
See our latest analysis for GLOBALFOUNDRIES
Above you can see how the current ROCE for GLOBALFOUNDRIES compares to its prior returns on capital, but there's only so much you can tell from the past. If you'd like to see what analysts are forecasting going forward, you should check out our free analyst report for GLOBALFOUNDRIES .
What Does the ROCE Trend For GLOBALFOUNDRIES Tell Us?
GLOBALFOUNDRIES has recently broken into profitability so their prior investments seem to be paying off. About four years ago the company was generating losses but things have turned around because it's now earning 6.7% on its capital. Not only that, but the company is utilizing 33% more capital than before, but that's to be expected from a company trying to break into profitability. This can indicate that there's plenty of opportunities to invest capital internally and at ever higher rates, both common traits of a multi-bagger.
Our Take On GLOBALFOUNDRIES' ROCE
Long story short, we're delighted to see that GLOBALFOUNDRIES' reinvestment activities have paid off and the company is now profitable. Since the total return from the stock has been almost flat over the last year, there might be an opportunity here if the valuation looks good. So researching this company further and determining whether or not these trends will continue seems justified.
GLOBALFOUNDRIES does have some risks though, and we've spotted 1 warning sign for GLOBALFOUNDRIES that you might be interested in.
For those who like to invest in solid companies, check out this free list of companies with solid balance sheets and high returns on equity.
Have feedback on this article? Concerned about the content? Get in touch with us directly. Alternatively, email editorial-team (at) simplywallst.com.
This article by Simply Wall St is general in nature. We provide commentary based on historical data and analyst forecasts only using an unbiased methodology and our articles are not intended to be financial advice. It does not constitute a recommendation to buy or sell any stock, and does not take account of your objectives, or your financial situation. We aim to bring you long-term focused analysis driven by fundamental data. Note that our analysis may not factor in the latest price-sensitive company announcements or qualitative material. Simply Wall St has no position in any stocks mentioned.
