
 Yahoo Finance
 General Motors (NYSE:GM) investors are sitting on a loss of 20% if they invested three years ago
As an investor its worth striving to ensure your overall portfolio beats the market average. But in any portfolio, there are likely to be some stocks that fall short of that benchmark. We regret to report that long term General Motors Company (NYSE:GM) shareholders have had that experience, with the share price dropping 21% in three years, versus a market return of about 18%. On the other hand, we note it's up 9.0% in about a month.
Since shareholders are down over the longer term, lets look at the underlying fundamentals over the that time and see if they've been consistent with returns.
Check out our latest analysis for General Motors
In his essay The Superinvestors of Graham-and-Doddsville Warren Buffett described how share prices do not always rationally reflect the value of a business. One imperfect but simple way to consider how the market perception of a company has shifted is to compare the change in the earnings per share (EPS) with the share price movement.
Although the share price is down over three years, General Motors actually managed to grow EPS by 14% per year in that time. Given the share price reaction, one might suspect that EPS is not a good guide to the business performance during the period (perhaps due to a one-off loss or gain). Or else the company was over-hyped in the past, and so its growth has disappointed.
It's worth taking a look at other metrics, because the EPS growth doesn't seem to match with the falling share price.
The modest 1.0% dividend yield is unlikely to be guiding the market view of the stock. We note that, in three years, revenue has actually grown at a 13% annual rate, so that doesn't seem to be a reason to sell shares. It's probably worth investigating General Motors further; while we may be missing something on this analysis, there might also be an opportunity.
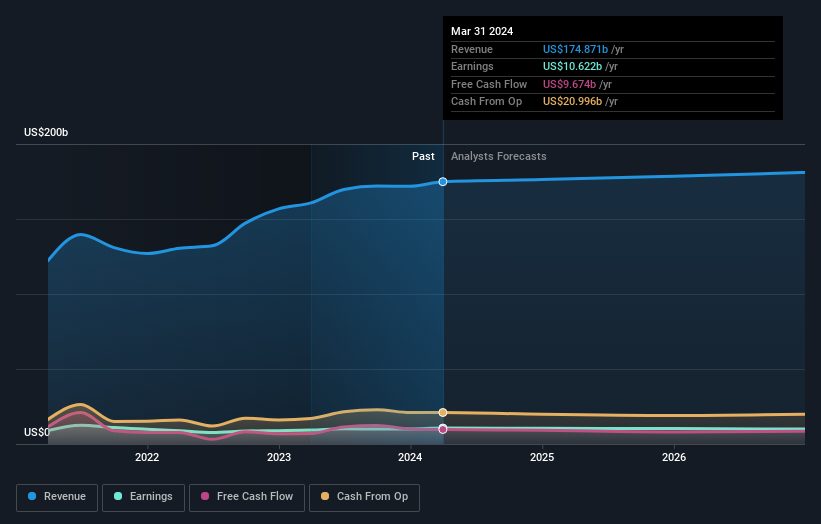
The graphic below depicts how earnings and revenue have changed over time (unveil the exact values by clicking on the image).
General Motors is well known by investors, and plenty of clever analysts have tried to predict the future profit levels. If you are thinking of buying or selling General Motors stock, you should check out this free report showing analyst consensus estimates for future profits.
A Different Perspective
General Motors' TSR for the year was broadly in line with the market average, at 22%. That gain looks pretty satisfying, and it is even better than the five-year TSR of 5% per year. It is possible that management foresight will bring growth well into the future, even if the share price slows down. I find it very interesting to look at share price over the long term as a proxy for business performance. But to truly gain insight, we need to consider other information, too. For instance, we've identified 3 warning signs for General Motors (2 are a bit concerning) that you should be aware of.
For those who like to find winning investments this free list of undervalued companies with recent insider purchasing, could be just the ticket.
Please note, the market returns quoted in this article reflect the market weighted average returns of stocks that currently trade on American exchanges.
Have feedback on this article? Concerned about the content? Get in touch with us directly. Alternatively, email editorial-team (at) simplywallst.com.
This article by Simply Wall St is general in nature. We provide commentary based on historical data and analyst forecasts only using an unbiased methodology and our articles are not intended to be financial advice. It does not constitute a recommendation to buy or sell any stock, and does not take account of your objectives, or your financial situation. We aim to bring you long-term focused analysis driven by fundamental data. Note that our analysis may not factor in the latest price-sensitive company announcements or qualitative material. Simply Wall St has no position in any stocks mentioned.
Have feedback on this article? Concerned about the content? Get in touch with us directly. Alternatively, email editorial-team@simplywallst.com
