
 Yahoo Finance
 Gap's (NYSE:GPS) Returns Have Hit A Wall
If you're not sure where to start when looking for the next multi-bagger, there are a few key trends you should keep an eye out for. Amongst other things, we'll want to see two things; firstly, a growing return on capital employed (ROCE) and secondly, an expansion in the company's amount of capital employed. If you see this, it typically means it's a company with a great business model and plenty of profitable reinvestment opportunities. Having said that, from a first glance at Gap (NYSE:GPS) we aren't jumping out of our chairs at how returns are trending, but let's have a deeper look.
Return On Capital Employed (ROCE): What Is It?
For those who don't know, ROCE is a measure of a company's yearly pre-tax profit (its return), relative to the capital employed in the business. To calculate this metric for Gap, this is the formula:
Return on Capital Employed = Earnings Before Interest and Tax (EBIT) ÷ (Total Assets - Current Liabilities)
0.099 = US$802m ÷ (US$11b - US$2.8b) (Based on the trailing twelve months to May 2024).
So, Gap has an ROCE of 9.9%. In absolute terms, that's a low return and it also under-performs the Specialty Retail industry average of 12%.
Check out our latest analysis for Gap
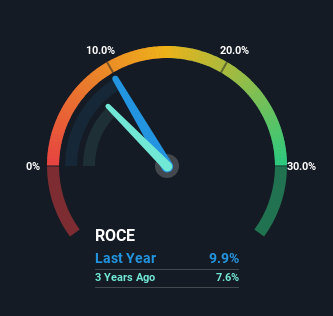
Above you can see how the current ROCE for Gap compares to its prior returns on capital, but there's only so much you can tell from the past. If you'd like, you can check out the forecasts from the analysts covering Gap for free.
The Trend Of ROCE
We're a bit concerned with the trends, because the business is applying 25% less capital than it was five years ago and returns on that capital have stayed flat. This indicates to us that assets are being sold and thus the business is likely shrinking, which you'll remember isn't the typical ingredients for an up-and-coming multi-bagger. Not only that, but the low returns on this capital mentioned earlier would leave most investors unimpressed.
The Bottom Line
It's a shame to see that Gap is effectively shrinking in terms of its capital base. Although the market must be expecting these trends to improve because the stock has gained 65% over the last five years. Ultimately, if the underlying trends persist, we wouldn't hold our breath on it being a multi-bagger going forward.
One more thing to note, we've identified 2 warning signs with Gap and understanding them should be part of your investment process.
While Gap may not currently earn the highest returns, we've compiled a list of companies that currently earn more than 25% return on equity. Check out this free list here.
Have feedback on this article? Concerned about the content? Get in touch with us directly. Alternatively, email editorial-team (at) simplywallst.com.
This article by Simply Wall St is general in nature. We provide commentary based on historical data and analyst forecasts only using an unbiased methodology and our articles are not intended to be financial advice. It does not constitute a recommendation to buy or sell any stock, and does not take account of your objectives, or your financial situation. We aim to bring you long-term focused analysis driven by fundamental data. Note that our analysis may not factor in the latest price-sensitive company announcements or qualitative material. Simply Wall St has no position in any stocks mentioned.
Have feedback on this article? Concerned about the content? Get in touch with us directly. Alternatively, email editorial-team@simplywallst.com
