
 Yahoo Finance
 Frencken Group's (SGX:E28) investors will be pleased with their impressive 167% return over the last five years
Frencken Group Limited (SGX:E28) shareholders might be concerned after seeing the share price drop 12% in the last quarter. But that doesn't change the fact that the returns over the last five years have been very strong. We think most investors would be happy with the 134% return, over that period. Generally speaking the long term returns will give you a better idea of business quality than short periods can. Ultimately business performance will determine whether the stock price continues the positive long term trend.
Let's take a look at the underlying fundamentals over the longer term, and see if they've been consistent with shareholders returns.
View our latest analysis for Frencken Group
There is no denying that markets are sometimes efficient, but prices do not always reflect underlying business performance. One flawed but reasonable way to assess how sentiment around a company has changed is to compare the earnings per share (EPS) with the share price.
During five years of share price growth, Frencken Group achieved compound earnings per share (EPS) growth of 1.2% per year. This EPS growth is slower than the share price growth of 18% per year, over the same period. This suggests that market participants hold the company in higher regard, these days. That's not necessarily surprising considering the five-year track record of earnings growth.
The graphic below depicts how EPS has changed over time (unveil the exact values by clicking on the image).
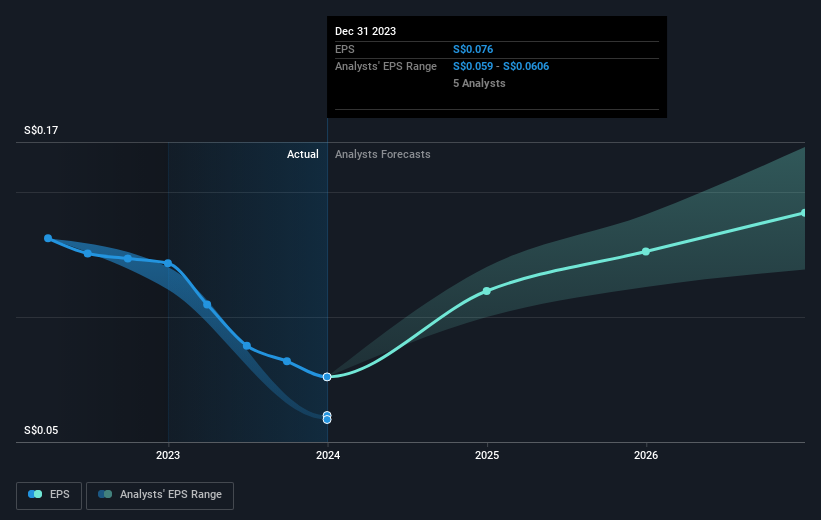
It might be well worthwhile taking a look at our free report on Frencken Group's earnings, revenue and cash flow.
What About Dividends?
It is important to consider the total shareholder return, as well as the share price return, for any given stock. The TSR is a return calculation that accounts for the value of cash dividends (assuming that any dividend received was reinvested) and the calculated value of any discounted capital raisings and spin-offs. Arguably, the TSR gives a more comprehensive picture of the return generated by a stock. As it happens, Frencken Group's TSR for the last 5 years was 167%, which exceeds the share price return mentioned earlier. This is largely a result of its dividend payments!
A Different Perspective
It's nice to see that Frencken Group shareholders have received a total shareholder return of 68% over the last year. And that does include the dividend. Since the one-year TSR is better than the five-year TSR (the latter coming in at 22% per year), it would seem that the stock's performance has improved in recent times. In the best case scenario, this may hint at some real business momentum, implying that now could be a great time to delve deeper. It's always interesting to track share price performance over the longer term. But to understand Frencken Group better, we need to consider many other factors. Consider for instance, the ever-present spectre of investment risk. We've identified 1 warning sign with Frencken Group , and understanding them should be part of your investment process.
We will like Frencken Group better if we see some big insider buys. While we wait, check out this free list of undervalued stocks (mostly small caps) with considerable, recent, insider buying.
Please note, the market returns quoted in this article reflect the market weighted average returns of stocks that currently trade on Singaporean exchanges.
Have feedback on this article? Concerned about the content? Get in touch with us directly. Alternatively, email editorial-team (at) simplywallst.com.
This article by Simply Wall St is general in nature. We provide commentary based on historical data and analyst forecasts only using an unbiased methodology and our articles are not intended to be financial advice. It does not constitute a recommendation to buy or sell any stock, and does not take account of your objectives, or your financial situation. We aim to bring you long-term focused analysis driven by fundamental data. Note that our analysis may not factor in the latest price-sensitive company announcements or qualitative material. Simply Wall St has no position in any stocks mentioned.
