
 Yahoo Finance
 Focusrite (LON:TUNE) Could Be Struggling To Allocate Capital
If we want to find a potential multi-bagger, often there are underlying trends that can provide clues. Firstly, we'll want to see a proven return on capital employed (ROCE) that is increasing, and secondly, an expanding base of capital employed. If you see this, it typically means it's a company with a great business model and plenty of profitable reinvestment opportunities. Having said that, from a first glance at Focusrite (LON:TUNE) we aren't jumping out of our chairs at how returns are trending, but let's have a deeper look.
Return On Capital Employed (ROCE): What Is It?
For those who don't know, ROCE is a measure of a company's yearly pre-tax profit (its return), relative to the capital employed in the business. To calculate this metric for Focusrite, this is the formula:
Return on Capital Employed = Earnings Before Interest and Tax (EBIT) ÷ (Total Assets - Current Liabilities)
0.13 = UK£18m ÷ (UK£201m - UK£66m) (Based on the trailing twelve months to February 2024).
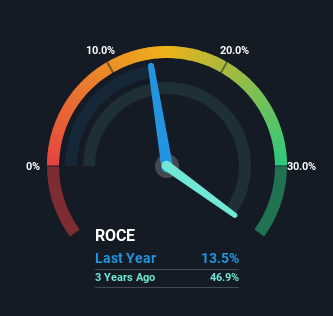
Thus, Focusrite has an ROCE of 13%. In absolute terms, that's a satisfactory return, but compared to the Consumer Durables industry average of 9.8% it's much better.
View our latest analysis for Focusrite
Above you can see how the current ROCE for Focusrite compares to its prior returns on capital, but there's only so much you can tell from the past. If you'd like to see what analysts are forecasting going forward, you should check out our free analyst report for Focusrite .
How Are Returns Trending?
On the surface, the trend of ROCE at Focusrite doesn't inspire confidence. Over the last five years, returns on capital have decreased to 13% from 27% five years ago. However it looks like Focusrite might be reinvesting for long term growth because while capital employed has increased, the company's sales haven't changed much in the last 12 months. It may take some time before the company starts to see any change in earnings from these investments.
On a side note, Focusrite's current liabilities have increased over the last five years to 33% of total assets, effectively distorting the ROCE to some degree. If current liabilities hadn't increased as much as they did, the ROCE could actually be even lower. Keep an eye on this ratio, because the business could encounter some new risks if this metric gets too high.
What We Can Learn From Focusrite's ROCE
Bringing it all together, while we're somewhat encouraged by Focusrite's reinvestment in its own business, we're aware that returns are shrinking. And investors appear hesitant that the trends will pick up because the stock has fallen 23% in the last five years. Therefore based on the analysis done in this article, we don't think Focusrite has the makings of a multi-bagger.
On a final note, we've found 2 warning signs for Focusrite that we think you should be aware of.
While Focusrite isn't earning the highest return, check out this free list of companies that are earning high returns on equity with solid balance sheets.
Have feedback on this article? Concerned about the content? Get in touch with us directly. Alternatively, email editorial-team (at) simplywallst.com.
This article by Simply Wall St is general in nature. We provide commentary based on historical data and analyst forecasts only using an unbiased methodology and our articles are not intended to be financial advice. It does not constitute a recommendation to buy or sell any stock, and does not take account of your objectives, or your financial situation. We aim to bring you long-term focused analysis driven by fundamental data. Note that our analysis may not factor in the latest price-sensitive company announcements or qualitative material. Simply Wall St has no position in any stocks mentioned.
Have feedback on this article? Concerned about the content? Get in touch with us directly. Alternatively, email editorial-team@simplywallst.com
