
 Yahoo Finance
 Exploring Three Japanese Exchange Growth Companies With Significant Insider Ownership
In a week marked by modest declines in major Japanese indices, investors are closely monitoring shifts in the market landscape, influenced by global economic signals and domestic policy adjustments. As we explore growth companies with high insider ownership on the Japanese exchange, it's crucial to consider how such firms might leverage deep-rooted leadership commitments to navigate through current market volatilities and capitalize on emerging opportunities.
Top 10 Growth Companies With High Insider Ownership In Japan
Name | Insider Ownership | Earnings Growth |
SHIFT (TSE:3697) | 35.4% | 27.2% |
Kanamic NetworkLTD (TSE:3939) | 25% | 28.9% |
Hottolink (TSE:3680) | 27% | 57.3% |
Micronics Japan (TSE:6871) | 15.3% | 39.7% |
Kasumigaseki CapitalLtd (TSE:3498) | 35.4% | 44.6% |
ExaWizards (TSE:4259) | 24.8% | 80.2% |
Money Forward (TSE:3994) | 21.4% | 63.5% |
Medley (TSE:4480) | 34% | 24.4% |
Soiken Holdings (TSE:2385) | 19.8% | 118.4% |
Soracom (TSE:147A) | 17.2% | 59.1% |
Let's review some notable picks from our screened stocks.
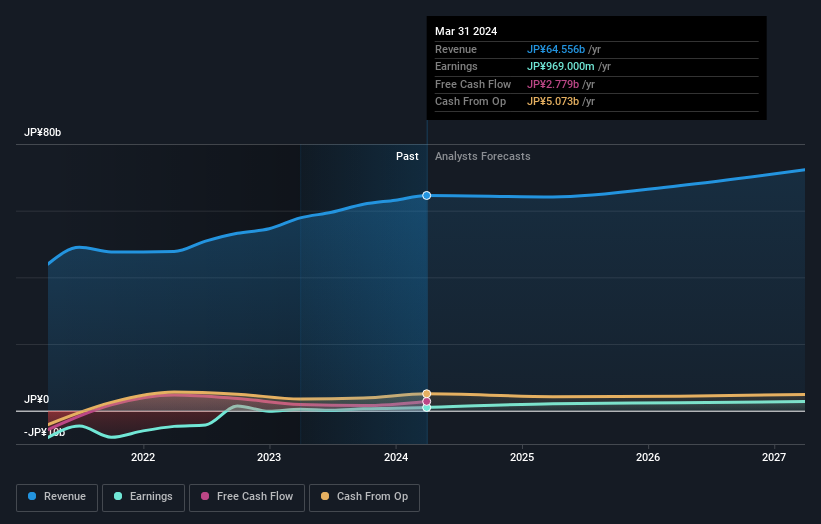
Saint Marc Holdings
Simply Wall St Growth Rating: ★★★★☆☆
Overview: Saint Marc Holdings Co., Ltd. operates a chain of restaurants and cafes primarily in Japan, with a market capitalization of approximately ¥42.91 billion.
Operations: The company primarily operates in the restaurant and cafe sector.
Insider Ownership: 26.9%
Earnings Growth Forecast: 27.1% p.a.
Saint Marc Holdings, a growth company in Japan with high insider ownership, shows a mixed financial landscape. While the company's earnings are forecasted to grow at 27.1% annually, outpacing the Japanese market average of 8.5%, its revenue growth is more modest at 4% per year, slightly above the market's 3.9%. However, its dividend coverage is weak as earnings do not sufficiently cover a 2.38% dividend yield. Additionally, recent financial results have been affected by large one-off items, clouding true earnings quality.
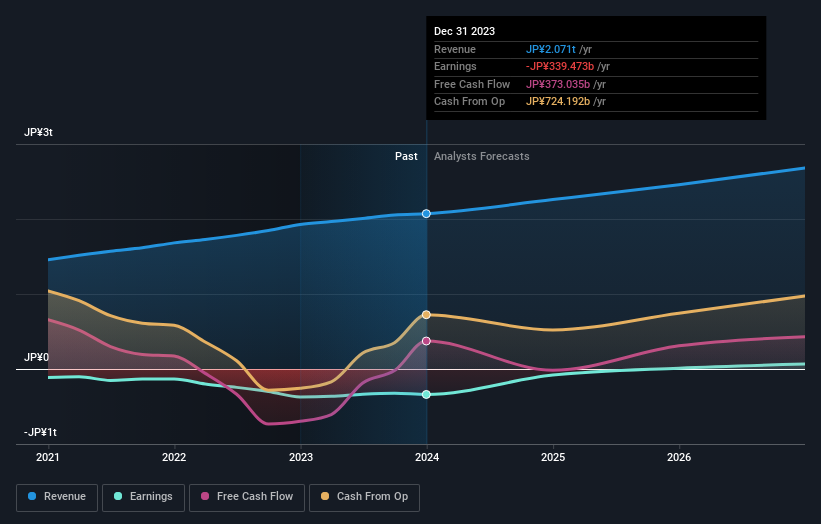
Rakuten Group
Simply Wall St Growth Rating: ★★★★☆☆
Overview: Rakuten Group, Inc. operates in e-commerce, fintech, digital content, and communications sectors serving a diverse global audience with a market capitalization of approximately ¥1.72 trillion.
Operations: The company generates revenue from its operations in e-commerce, fintech, digital content, and communications.
Insider Ownership: 17.3%
Earnings Growth Forecast: 87.6% p.a.
Rakuten Group is poised for notable growth with earnings expected to surge by 87.58% annually, significantly outpacing typical market performance. Despite a recent $1.99 billion bond issuance and robust corporate guidance predicting double-digit growth in 2024, challenges remain such as shareholder dilution over the past year and a low forecasted return on equity of 8.8%. Additionally, revenue growth projections of 7.4% per year, though above the Japanese market average, fall short of more aggressive benchmarks.
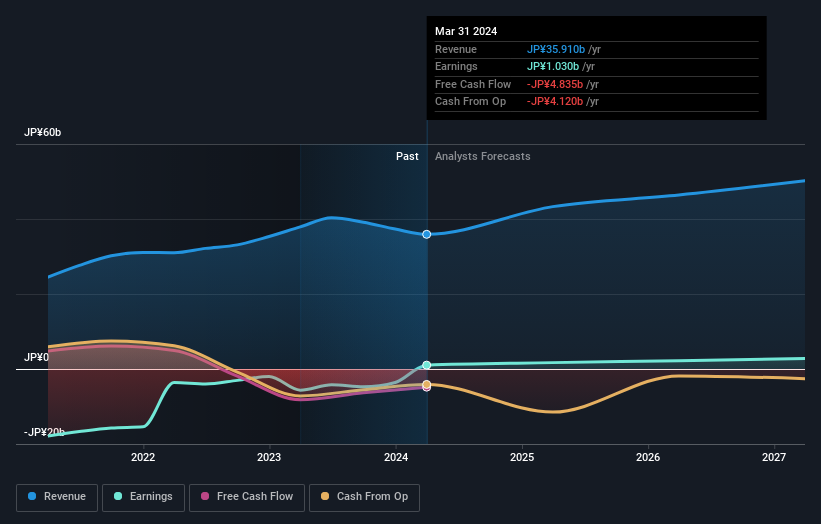
Shima Seiki Mfg.Ltd
Simply Wall St Growth Rating: ★★★★☆☆
Overview: Shima Seiki Mfg., Ltd. operates globally, specializing in the development, manufacture, and sale of computerized knitting and fabric cutting machines, with a market capitalization of approximately ¥50.91 billion.
Operations: The company generates revenue from the sale of computerized flat knitting machines, automatic fabric cutting machines, design systems, and glove and sock knitting machines across various global markets.
Insider Ownership: 10.3%
Earnings Growth Forecast: 30.1% p.a.
Shima Seiki Mfg., Ltd. is set to report fiscal 2024 results on May 10, showcasing its robust growth trajectory with earnings and revenue both forecasted to outpace the Japanese market significantly. Despite becoming profitable this year, challenges include a low projected return on equity of 2.9% in three years and financial results influenced by large one-off items. The company has not seen insider trading activity in the past three months, emphasizing stable insider ownership amidst growth.
Where To Now?
Navigate through the entire inventory of 110 Fast Growing Japanese Companies With High Insider Ownership here.
Have a stake in these businesses? Integrate your holdings into Simply Wall St's portfolio for notifications and detailed stock reports.
Take control of your financial future using Simply Wall St, offering free, in-depth knowledge of international markets to every investor.
Looking For Alternative Opportunities?
Explore high-performing small cap companies that haven't yet garnered significant analyst attention.
Diversify your portfolio with solid dividend payers offering reliable income streams to weather potential market turbulence.
Find companies with promising cash flow potential yet trading below their fair value.
This article by Simply Wall St is general in nature. We provide commentary based on historical data and analyst forecasts only using an unbiased methodology and our articles are not intended to be financial advice. It does not constitute a recommendation to buy or sell any stock, and does not take account of your objectives, or your financial situation. We aim to bring you long-term focused analysis driven by fundamental data. Note that our analysis may not factor in the latest price-sensitive company announcements or qualitative material. Simply Wall St has no position in any stocks mentioned.The analysis only considers stock directly held by insiders. It does not include indirectly owned stock through other vehicles such as corporate and/or trust entities. All forecast revenue and earnings growth rates quoted are in terms of annualised (per annum) growth rates over 1-3 years.
Companies discussed in this article include TSE:3395 TSE:4755 and TSE:6222.
Have feedback on this article? Concerned about the content? Get in touch with us directly. Alternatively, email editorial-team@simplywallst.com
