
 Yahoo Finance
 Even though Synaptics (NASDAQ:SYNA) has lost US$151m market cap in last 7 days, shareholders are still up 185% over 5 years
It hasn't been the best quarter for Synaptics Incorporated (NASDAQ:SYNA) shareholders, since the share price has fallen 12% in that time. But that doesn't change the fact that the returns over the last five years have been very strong. We think most investors would be happy with the 185% return, over that period. Generally speaking the long term returns will give you a better idea of business quality than short periods can. Ultimately business performance will determine whether the stock price continues the positive long term trend. While the returns over the last 5 years have been good, we do feel sorry for those shareholders who haven't held shares that long, because the share price is down 44% in the last three years.
Although Synaptics has shed US$151m from its market cap this week, let's take a look at its longer term fundamental trends and see if they've driven returns.
View our latest analysis for Synaptics
There is no denying that markets are sometimes efficient, but prices do not always reflect underlying business performance. By comparing earnings per share (EPS) and share price changes over time, we can get a feel for how investor attitudes to a company have morphed over time.
Over half a decade, Synaptics managed to grow its earnings per share at 5.7% a year. This EPS growth is lower than the 23% average annual increase in the share price. So it's fair to assume the market has a higher opinion of the business than it did five years ago. And that's hardly shocking given the track record of growth.
The image below shows how EPS has tracked over time (if you click on the image you can see greater detail).
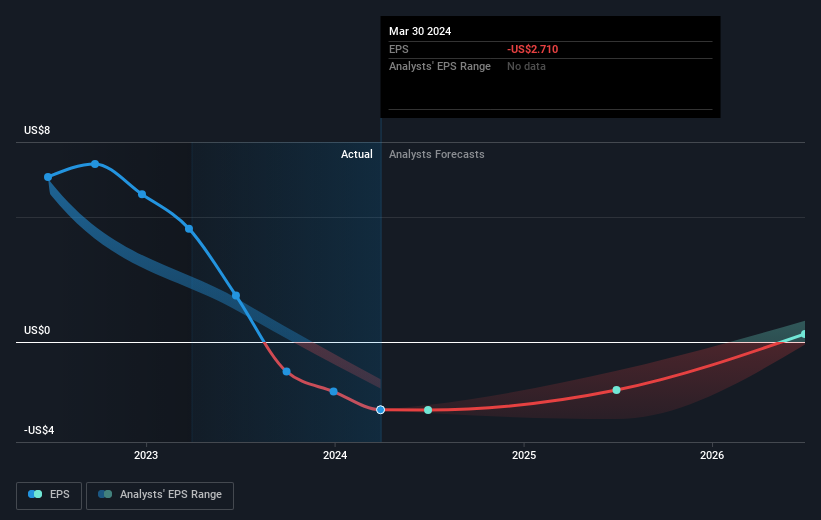
Before buying or selling a stock, we always recommend a close examination of historic growth trends, available here.
A Different Perspective
Synaptics provided a TSR of 1.1% over the last twelve months. But that return falls short of the market. It's probably a good sign that the company has an even better long term track record, having provided shareholders with an annual TSR of 23% over five years. It may well be that this is a business worth popping on the watching, given the continuing positive reception, over time, from the market. Before spending more time on Synaptics it might be wise to click here to see if insiders have been buying or selling shares.
For those who like to find winning investments this free list of undervalued companies with recent insider purchasing, could be just the ticket.
Please note, the market returns quoted in this article reflect the market weighted average returns of stocks that currently trade on American exchanges.
Have feedback on this article? Concerned about the content? Get in touch with us directly. Alternatively, email editorial-team (at) simplywallst.com.
This article by Simply Wall St is general in nature. We provide commentary based on historical data and analyst forecasts only using an unbiased methodology and our articles are not intended to be financial advice. It does not constitute a recommendation to buy or sell any stock, and does not take account of your objectives, or your financial situation. We aim to bring you long-term focused analysis driven by fundamental data. Note that our analysis may not factor in the latest price-sensitive company announcements or qualitative material. Simply Wall St has no position in any stocks mentioned.
Have feedback on this article? Concerned about the content? Get in touch with us directly. Alternatively, email editorial-team@simplywallst.com
