
 Yahoo Finance
 Even after rising 16% this past week, MYP (SGX:F86) shareholders are still down 61% over the past five years
It is doubtless a positive to see that the MYP Ltd. (SGX:F86) share price has gained some 33% in the last three months. But don't envy holders -- looking back over 5 years the returns have been really bad. Indeed, the share price is down 61% in the period. So we're not so sure if the recent bounce should be celebrated. But it could be that the fall was overdone.
While the last five years has been tough for MYP shareholders, this past week has shown signs of promise. So let's look at the longer term fundamentals and see if they've been the driver of the negative returns.
Check out our latest analysis for MYP
MYP wasn't profitable in the last twelve months, it is unlikely we'll see a strong correlation between its share price and its earnings per share (EPS). Arguably revenue is our next best option. Generally speaking, companies without profits are expected to grow revenue every year, and at a good clip. As you can imagine, fast revenue growth, when maintained, often leads to fast profit growth.
Over half a decade MYP reduced its trailing twelve month revenue by 7.4% for each year. That's not what investors generally want to see. The share price decline of 10% compound, over five years, is understandable given the company is losing money, and revenue is moving in the wrong direction. The chance of imminent investor enthusiasm for this stock seems slimmer than Louise Brooks. Not that many investors like to invest in companies that are losing money and not growing revenue.
The image below shows how earnings and revenue have tracked over time (if you click on the image you can see greater detail).
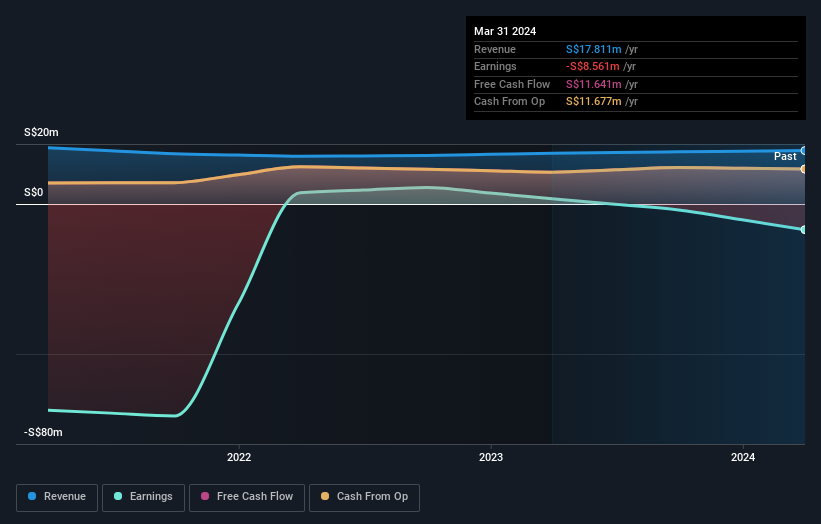
It's probably worth noting that the CEO is paid less than the median at similar sized companies. But while CEO remuneration is always worth checking, the really important question is whether the company can grow earnings going forward. It might be well worthwhile taking a look at our free report on MYP's earnings, revenue and cash flow.
A Different Perspective
MYP provided a TSR of 4.8% over the last twelve months. But that return falls short of the market. But at least that's still a gain! Over five years the TSR has been a reduction of 10% per year, over five years. So this might be a sign the business has turned its fortunes around. It's always interesting to track share price performance over the longer term. But to understand MYP better, we need to consider many other factors. To that end, you should learn about the 2 warning signs we've spotted with MYP (including 1 which is a bit concerning) .
But note: MYP may not be the best stock to buy. So take a peek at this free list of interesting companies with past earnings growth (and further growth forecast).
Please note, the market returns quoted in this article reflect the market weighted average returns of stocks that currently trade on Singaporean exchanges.
Have feedback on this article? Concerned about the content? Get in touch with us directly. Alternatively, email editorial-team (at) simplywallst.com.
This article by Simply Wall St is general in nature. We provide commentary based on historical data and analyst forecasts only using an unbiased methodology and our articles are not intended to be financial advice. It does not constitute a recommendation to buy or sell any stock, and does not take account of your objectives, or your financial situation. We aim to bring you long-term focused analysis driven by fundamental data. Note that our analysis may not factor in the latest price-sensitive company announcements or qualitative material. Simply Wall St has no position in any stocks mentioned.
Have feedback on this article? Concerned about the content? Get in touch with us directly. Alternatively, email editorial-team@simplywallst.com
