
 Yahoo Finance
 Estimating The Fair Value Of Unitil Corporation (NYSE:UTL)
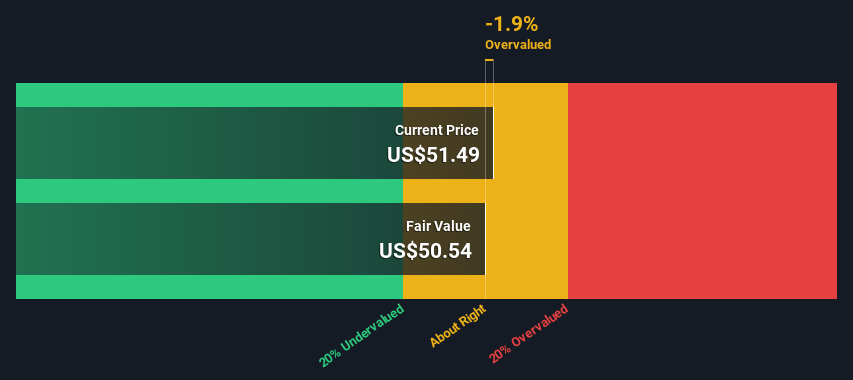
Key Insights
Using the Dividend Discount Model, Unitil fair value estimate is US$50.54
Current share price of US$51.49 suggests Unitil is potentially trading close to its fair value
Our fair value estimate is 5.2% lower than Unitil's analyst price target of US$53.33
How far off is Unitil Corporation (NYSE:UTL) from its intrinsic value? Using the most recent financial data, we'll take a look at whether the stock is fairly priced by projecting its future cash flows and then discounting them to today's value. The Discounted Cash Flow (DCF) model is the tool we will apply to do this. It may sound complicated, but actually it is quite simple!
We generally believe that a company's value is the present value of all of the cash it will generate in the future. However, a DCF is just one valuation metric among many, and it is not without flaws. If you still have some burning questions about this type of valuation, take a look at the Simply Wall St analysis model.
View our latest analysis for Unitil
What's The Estimated Valuation?
As Unitil operates in the integrated utilities sector, we need to calculate the intrinsic value slightly differently. In this approach dividends per share (DPS) are used, as free cash flow is difficult to estimate and often not reported by analysts. Unless a company pays out the majority of its FCF as a dividend, this method will typically underestimate the value of the stock. We use the Gordon Growth Model, which assumes dividend will grow into perpetuity at a rate that can be sustained. For a number of reasons a very conservative growth rate is used that cannot exceed that of a company's Gross Domestic Product (GDP). In this case we used the 5-year average of the 10-year government bond yield (2.4%). The expected dividend per share is then discounted to today's value at a cost of equity of 6.1%. Relative to the current share price of US$51.5, the company appears around fair value at the time of writing. The assumptions in any calculation have a big impact on the valuation, so it is better to view this as a rough estimate, not precise down to the last cent.
Value Per Share = Expected Dividend Per Share / (Discount Rate - Perpetual Growth Rate)
= US$1.9 / (6.1% – 2.4%)
= US$50.5
The Assumptions
Now the most important inputs to a discounted cash flow are the discount rate, and of course, the actual cash flows. If you don't agree with these result, have a go at the calculation yourself and play with the assumptions. The DCF also does not consider the possible cyclicality of an industry, or a company's future capital requirements, so it does not give a full picture of a company's potential performance. Given that we are looking at Unitil as potential shareholders, the cost of equity is used as the discount rate, rather than the cost of capital (or weighted average cost of capital, WACC) which accounts for debt. In this calculation we've used 6.1%, which is based on a levered beta of 0.800. Beta is a measure of a stock's volatility, compared to the market as a whole. We get our beta from the industry average beta of globally comparable companies, with an imposed limit between 0.8 and 2.0, which is a reasonable range for a stable business.
SWOT Analysis for Unitil
Strength
Earnings growth over the past year exceeded its 5-year average.
Weakness
Earnings growth over the past year underperformed the Integrated Utilities industry.
Interest payments on debt are not well covered.
Dividend is low compared to the top 25% of dividend payers in the Integrated Utilities market.
Opportunity
Annual earnings are forecast to grow for the next 3 years.
Good value based on P/E ratio compared to estimated Fair P/E ratio.
Threat
Debt is not well covered by operating cash flow.
Paying a dividend but company has no free cash flows.
Annual earnings are forecast to grow slower than the American market.
Looking Ahead:
Whilst important, the DCF calculation shouldn't be the only metric you look at when researching a company. DCF models are not the be-all and end-all of investment valuation. Instead the best use for a DCF model is to test certain assumptions and theories to see if they would lead to the company being undervalued or overvalued. For example, changes in the company's cost of equity or the risk free rate can significantly impact the valuation. For Unitil, there are three pertinent items you should explore:
Risks: Case in point, we've spotted 2 warning signs for Unitil you should be aware of, and 1 of them is a bit unpleasant.
Future Earnings: How does UTL's growth rate compare to its peers and the wider market? Dig deeper into the analyst consensus number for the upcoming years by interacting with our free analyst growth expectation chart.
Other High Quality Alternatives: Do you like a good all-rounder? Explore our interactive list of high quality stocks to get an idea of what else is out there you may be missing!
PS. The Simply Wall St app conducts a discounted cash flow valuation for every stock on the NYSE every day. If you want to find the calculation for other stocks just search here.
Have feedback on this article? Concerned about the content? Get in touch with us directly. Alternatively, email editorial-team (at) simplywallst.com.
This article by Simply Wall St is general in nature. We provide commentary based on historical data and analyst forecasts only using an unbiased methodology and our articles are not intended to be financial advice. It does not constitute a recommendation to buy or sell any stock, and does not take account of your objectives, or your financial situation. We aim to bring you long-term focused analysis driven by fundamental data. Note that our analysis may not factor in the latest price-sensitive company announcements or qualitative material. Simply Wall St has no position in any stocks mentioned.
