
 Yahoo Finance
 The Equity Bull Case (5 Must-See Charts!)
Want to know what a market will do? Consulting a chart is the best way to see what will happen next, because charts are based on the simplest tenants of economics – supply and demand. Below are 5 must-see charts that suggest the market is closer to a bottom than you may think:
CNN Fear & Greed Index
The CNN Fear & Greed Index measures investor sentiment in the US equity market. Fear & Greed is derived through a composite of factors, including market trend, stock price strength, breadth (participation), put-to-call ratio, volatility, trading volume, and safe-haven demand. From its diverse bucket of metrics, CNN then creates a numerical score from 0 to 100, with 0 being extreme fear and 100 being extreme greed.
Spin: Fear & Greed is best used as a contrarian indicator. In the words of General George S. Patton, “If everyone is thinking alike, then somebody isn’t thinking.” The fact that CNN’s Fear & Greed Indicator is at an extreme greed level and is at the lowest level of 2023 should give bulls hope for a year-end rally.
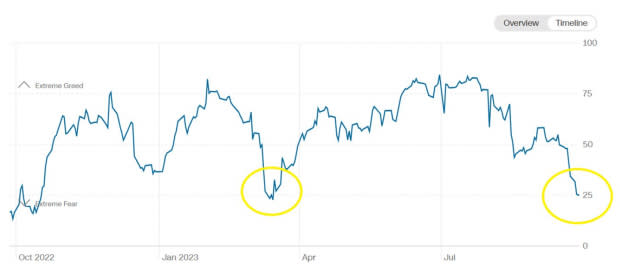
Image Source: CNN
The US Dollar
An overly strong US dollar can adversely affect US equities. For example, an inflated dollar can hurt the competitiveness of American exporters (US goods & services become more expensive), weigh on US-based multinationals (overseas earnings get transferred back into dollars, reducing corporate profits), and finally can detract foreign investment into US equities themselves.
Spin: The US Dollar Index (DXY) and the Invesco USD Index Bullish Fund ETF (UUP) are up eleven straight weeks and are approaching resistance (supply). A pullback in the US Dollar would be supportive of equities.
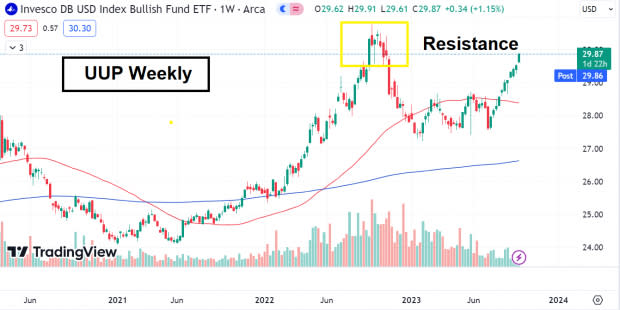
Image Source: TradingView
Seasonality
In 2023, historic seasonal trends have perhaps been the best, most accurate roadmap for investors. The pre-presidential election roadmap is the optimal roadmap for investors to consult. Typically, equities rally into the late summer (like in 2023) and bottom in late October.
Spin: Because seasonality has been so accurate, investors have little reason to abandon it now. Look for a rally into year-end.
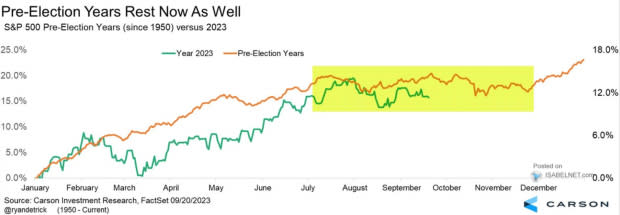
Image Source: Ryan Detrick, Carson Research
SPY Weekly Trendline
In equity trading, trendline support refers to a specific price level or line on a chart representing a historical trend where the instrument’s price tends to find buying interest and bounce upward. Typically, trendlines are drawn as a straight, diagonal line and should cover at least three significant touches. Longer time frames tend to have more meaning for traders.
Spin: Thus far this week, the S&P 500 Index ETF (SPY) found support at its weekly trendline nearly to the penny and reversed violently – a bullish sign.
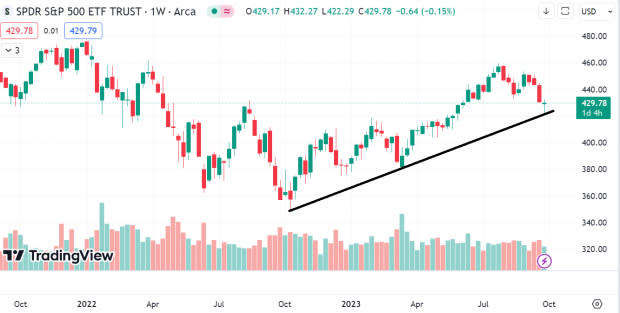
Image Source: TradingView
Semis
Semiconductor stocks such as Nvidia (NVDA) and Advanced Micro Devices (AMD) are the lifeblood of the current bull market. Why? A major part of the bull case in equities is that the AI revolution will lead to higher earnings and allow high-tech stocks to grow into their seemingly lofty valuations.
Spin: The Direxion 3x PHLX Semiconductor Sector Index (SOXL) stood out Thursday, rising more than 7% for the session while finding support at its 200-day moving average. Buying interest in semiconductors is indicative of a “risk on” mood.
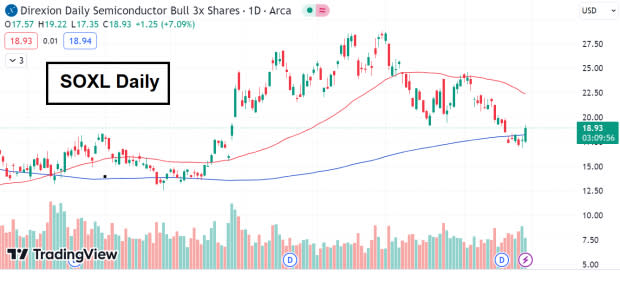
Image Source: TradingView
Bottom Line
After lulling investors to sleep in the past few months, several charts suggest that equities may wake up in a big way into year-end.
Want the latest recommendations from Zacks Investment Research? Today, you can download 7 Best Stocks for the Next 30 Days. Click to get this free report
Advanced Micro Devices, Inc. (AMD) : Free Stock Analysis Report
NVIDIA Corporation (NVDA) : Free Stock Analysis Report
SPDR S&P 500 ETF (SPY): ETF Research Reports
Invesco DB US Dollar Index Bullish ETF (UUP): ETF Research Reports
Direxion Daily Semiconductor Bull 3X Shares (SOXL): ETF Research Reports
