
 Yahoo Finance
 Engenco's (ASX:EGN) Returns On Capital Not Reflecting Well On The Business
What trends should we look for it we want to identify stocks that can multiply in value over the long term? Ideally, a business will show two trends; firstly a growing return on capital employed (ROCE) and secondly, an increasing amount of capital employed. Put simply, these types of businesses are compounding machines, meaning they are continually reinvesting their earnings at ever-higher rates of return. However, after investigating Engenco (ASX:EGN), we don't think it's current trends fit the mold of a multi-bagger.
What Is Return On Capital Employed (ROCE)?
For those who don't know, ROCE is a measure of a company's yearly pre-tax profit (its return), relative to the capital employed in the business. Analysts use this formula to calculate it for Engenco:
Return on Capital Employed = Earnings Before Interest and Tax (EBIT) ÷ (Total Assets - Current Liabilities)
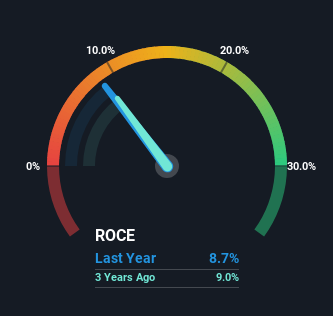
0.087 = AU$10m ÷ (AU$181m - AU$66m) (Based on the trailing twelve months to December 2023).
Therefore, Engenco has an ROCE of 8.7%. Ultimately, that's a low return and it under-performs the Machinery industry average of 13%.
Check out our latest analysis for Engenco
While the past is not representative of the future, it can be helpful to know how a company has performed historically, which is why we have this chart above. If you're interested in investigating Engenco's past further, check out this free graph covering Engenco's past earnings, revenue and cash flow.
How Are Returns Trending?
When we looked at the ROCE trend at Engenco, we didn't gain much confidence. Over the last five years, returns on capital have decreased to 8.7% from 16% five years ago. Although, given both revenue and the amount of assets employed in the business have increased, it could suggest the company is investing in growth, and the extra capital has led to a short-term reduction in ROCE. If these investments prove successful, this can bode very well for long term stock performance.
On a side note, Engenco's current liabilities have increased over the last five years to 36% of total assets, effectively distorting the ROCE to some degree. If current liabilities hadn't increased as much as they did, the ROCE could actually be even lower. While the ratio isn't currently too high, it's worth keeping an eye on this because if it gets particularly high, the business could then face some new elements of risk.
The Bottom Line
While returns have fallen for Engenco in recent times, we're encouraged to see that sales are growing and that the business is reinvesting in its operations. These growth trends haven't led to growth returns though, since the stock has fallen 56% over the last five years. As a result, we'd recommend researching this stock further to uncover what other fundamentals of the business can show us.
If you want to know some of the risks facing Engenco we've found 5 warning signs (1 is a bit unpleasant!) that you should be aware of before investing here.
While Engenco isn't earning the highest return, check out this free list of companies that are earning high returns on equity with solid balance sheets.
Have feedback on this article? Concerned about the content? Get in touch with us directly. Alternatively, email editorial-team (at) simplywallst.com.
This article by Simply Wall St is general in nature. We provide commentary based on historical data and analyst forecasts only using an unbiased methodology and our articles are not intended to be financial advice. It does not constitute a recommendation to buy or sell any stock, and does not take account of your objectives, or your financial situation. We aim to bring you long-term focused analysis driven by fundamental data. Note that our analysis may not factor in the latest price-sensitive company announcements or qualitative material. Simply Wall St has no position in any stocks mentioned.
Have feedback on this article? Concerned about the content? Get in touch with us directly. Alternatively, email editorial-team@simplywallst.com
