
 Yahoo Finance
 Earnings growth of 3.2% over 3 years hasn't been enough to translate into positive returns for FDM Group (Holdings) (LON:FDM) shareholders
If you are building a properly diversified stock portfolio, the chances are some of your picks will perform badly. But the long term shareholders of FDM Group (Holdings) plc (LON:FDM) have had an unfortunate run in the last three years. So they might be feeling emotional about the 59% share price collapse, in that time. The more recent news is of little comfort, with the share price down 42% in a year. On top of that, the share price is down 9.0% in the last week.
Since FDM Group (Holdings) has shed UK£44m from its value in the past 7 days, let's see if the longer term decline has been driven by the business' economics.
Check out our latest analysis for FDM Group (Holdings)
While the efficient markets hypothesis continues to be taught by some, it has been proven that markets are over-reactive dynamic systems, and investors are not always rational. One flawed but reasonable way to assess how sentiment around a company has changed is to compare the earnings per share (EPS) with the share price.
Although the share price is down over three years, FDM Group (Holdings) actually managed to grow EPS by 9.9% per year in that time. Given the share price reaction, one might suspect that EPS is not a good guide to the business performance during the period (perhaps due to a one-off loss or gain). Alternatively, growth expectations may have been unreasonable in the past.
It's worth taking a look at other metrics, because the EPS growth doesn't seem to match with the falling share price.
It's quite likely that the declining dividend has caused some investors to sell their shares, pushing the price lower in the process. It doesn't seem like the changes in revenue would have impacted the share price much, but a closer inspection of the data might reveal something.
The image below shows how earnings and revenue have tracked over time (if you click on the image you can see greater detail).
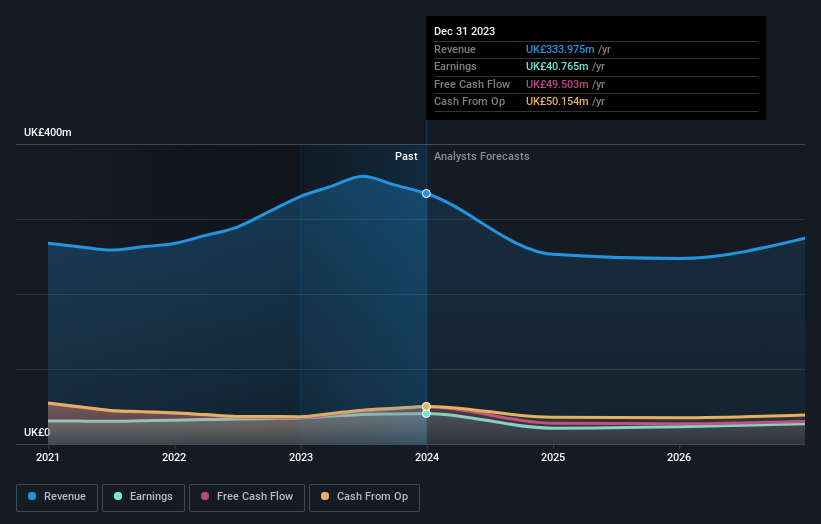
We know that FDM Group (Holdings) has improved its bottom line lately, but what does the future have in store? You can see what analysts are predicting for FDM Group (Holdings) in this interactive graph of future profit estimates.
What About Dividends?
As well as measuring the share price return, investors should also consider the total shareholder return (TSR). The TSR is a return calculation that accounts for the value of cash dividends (assuming that any dividend received was reinvested) and the calculated value of any discounted capital raisings and spin-offs. So for companies that pay a generous dividend, the TSR is often a lot higher than the share price return. As it happens, FDM Group (Holdings)'s TSR for the last 3 years was -53%, which exceeds the share price return mentioned earlier. The dividends paid by the company have thusly boosted the total shareholder return.
A Different Perspective
Investors in FDM Group (Holdings) had a tough year, with a total loss of 37% (including dividends), against a market gain of about 10%. Even the share prices of good stocks drop sometimes, but we want to see improvements in the fundamental metrics of a business, before getting too interested. Regrettably, last year's performance caps off a bad run, with the shareholders facing a total loss of 8% per year over five years. Generally speaking long term share price weakness can be a bad sign, though contrarian investors might want to research the stock in hope of a turnaround. While it is well worth considering the different impacts that market conditions can have on the share price, there are other factors that are even more important. Like risks, for instance. Every company has them, and we've spotted 3 warning signs for FDM Group (Holdings) (of which 1 is a bit concerning!) you should know about.
If you are like me, then you will not want to miss this free list of undervalued small caps that insiders are buying.
Please note, the market returns quoted in this article reflect the market weighted average returns of stocks that currently trade on British exchanges.
Have feedback on this article? Concerned about the content? Get in touch with us directly. Alternatively, email editorial-team (at) simplywallst.com.
This article by Simply Wall St is general in nature. We provide commentary based on historical data and analyst forecasts only using an unbiased methodology and our articles are not intended to be financial advice. It does not constitute a recommendation to buy or sell any stock, and does not take account of your objectives, or your financial situation. We aim to bring you long-term focused analysis driven by fundamental data. Note that our analysis may not factor in the latest price-sensitive company announcements or qualitative material. Simply Wall St has no position in any stocks mentioned.
