
 Yahoo Finance
 How Does Capital First Limited’s (NSE:CAPF) Earnings Growth Stack Up Against Industry Performance?

After looking at Capital First Limited’s (NSEI:CAPF) latest earnings announcement (31 March 2018), I found it useful to revisit the company’s performance in the past couple of years and assess this against the most recent figures. As a long term investor, I pay close attention to earnings trend, rather than the figures published at one point in time. I also compare against an industry benchmark to check whether Capital First’s performance has been impacted by industry movements. In this article I briefly touch on my key findings. See our latest analysis for Capital First
Could CAPF beat the long-term trend and outperform its industry?
For the most up-to-date info, I use data from the most recent 12 months, which either annualizes the most recent 6-month earnings update, or in some cases, the most recent annual report is already the latest available financial data. This blend allows me to analyze many different companies on a similar basis, using the most relevant data points. For Capital First, its most recent bottom-line (trailing twelve month) is ₹3.28B, which, relative to the previous year’s figure, has moved up by 36.78%. Given that these figures are relatively nearsighted, I’ve determined an annualized five-year value for CAPF’s earnings, which stands at ₹1.37B This suggests that, on average, Capital First has been able to consistently improve its profits over the last couple of years as well.
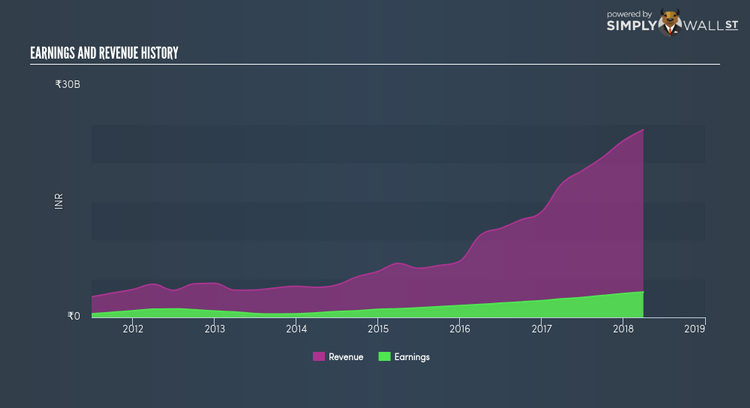
What’s enabled this growth? Let’s take a look at whether it is only due to industry tailwinds, or if Capital First has seen some company-specific growth. The rise in earnings seems to be supported by a strong top-line increase overtaking its growth rate of expenses. Though this has caused a margin contraction, it has made Capital First more profitable. Viewing growth from a sector-level, the IN consumer finance industry has been growing its average earnings by double-digit 15.40% over the past twelve months, and 10.20% over the last five years. This shows that whatever tailwind the industry is profiting from, Capital First is capable of amplifying this to its advantage.
What does this mean?
While past data is useful, it doesn’t tell the whole story. Positive growth and profitability are what investors like to see in a company’s track record, but how do we properly assess sustainability? I suggest you continue to research Capital First to get a more holistic view of the stock by looking at:
Future Outlook: What are well-informed industry analysts predicting for CAPF’s future growth? Take a look at our free research report of analyst consensus for CAPF’s outlook.
Financial Health: Is CAPF’s operations financially sustainable? Balance sheets can be hard to analyze, which is why we’ve done it for you. Check out our financial health checks here.
Other High-Performing Stocks: Are there other stocks that provide better prospects with proven track records? Explore our free list of these great stocks here.
NB: Figures in this article are calculated using data from the trailing twelve months from 31 March 2018. This may not be consistent with full year annual report figures.
To help readers see pass the short term volatility of the financial market, we aim to bring you a long-term focused research analysis purely driven by fundamental data. Note that our analysis does not factor in the latest price sensitive company announcements.
The author is an independent contributor and at the time of publication had no position in the stocks mentioned.
