
 Yahoo Finance
 Does Canada Goose Holdings Inc. (TSE:GOOS) Create Value For Shareholders?
Many investors are still learning about the various metrics that can be useful when analysing a stock. This article is for those who would like to learn about Return On Equity (ROE). To keep the lesson grounded in practicality, we'll use ROE to better understand Canada Goose Holdings Inc. (TSE:GOOS).
ROE or return on equity is a useful tool to assess how effectively a company can generate returns on the investment it received from its shareholders. In other words, it is a profitability ratio which measures the rate of return on the capital provided by the company's shareholders.
See our latest analysis for Canada Goose Holdings
How Do You Calculate Return On Equity?
Return on equity can be calculated by using the formula:
Return on Equity = Net Profit (from continuing operations) ÷ Shareholders' Equity
So, based on the above formula, the ROE for Canada Goose Holdings is:
13% = CA$47m ÷ CA$356m (Based on the trailing twelve months to October 2023).
The 'return' refers to a company's earnings over the last year. Another way to think of that is that for every CA$1 worth of equity, the company was able to earn CA$0.13 in profit.
Does Canada Goose Holdings Have A Good ROE?
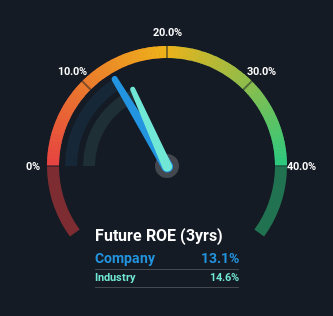
One simple way to determine if a company has a good return on equity is to compare it to the average for its industry. Importantly, this is far from a perfect measure, because companies differ significantly within the same industry classification. The image below shows that Canada Goose Holdings has an ROE that is roughly in line with the Luxury industry average (15%).
So while the ROE is not exceptional, at least its acceptable. Even if the ROE is respectable when compared to the industry, its worth checking if the firm's ROE is being aided by high debt levels. If true, then it is more an indication of risk than the potential. You can see the 3 risks we have identified for Canada Goose Holdings by visiting our risks dashboard for free on our platform here.
How Does Debt Impact ROE?
Most companies need money -- from somewhere -- to grow their profits. The cash for investment can come from prior year profits (retained earnings), issuing new shares, or borrowing. In the case of the first and second options, the ROE will reflect this use of cash, for growth. In the latter case, the use of debt will improve the returns, but will not change the equity. That will make the ROE look better than if no debt was used.
Combining Canada Goose Holdings' Debt And Its 13% Return On Equity
It's worth noting the high use of debt by Canada Goose Holdings, leading to its debt to equity ratio of 1.57. There's no doubt its ROE is decent, but the very high debt the company carries is not too exciting to see. Investors should think carefully about how a company might perform if it was unable to borrow so easily, because credit markets do change over time.
Summary
Return on equity is useful for comparing the quality of different businesses. A company that can achieve a high return on equity without debt could be considered a high quality business. All else being equal, a higher ROE is better.
But ROE is just one piece of a bigger puzzle, since high quality businesses often trade on high multiples of earnings. The rate at which profits are likely to grow, relative to the expectations of profit growth reflected in the current price, must be considered, too. So you might want to check this FREE visualization of analyst forecasts for the company.
Of course, you might find a fantastic investment by looking elsewhere. So take a peek at this free list of interesting companies.
Have feedback on this article? Concerned about the content? Get in touch with us directly. Alternatively, email editorial-team (at) simplywallst.com.
This article by Simply Wall St is general in nature. We provide commentary based on historical data and analyst forecasts only using an unbiased methodology and our articles are not intended to be financial advice. It does not constitute a recommendation to buy or sell any stock, and does not take account of your objectives, or your financial situation. We aim to bring you long-term focused analysis driven by fundamental data. Note that our analysis may not factor in the latest price-sensitive company announcements or qualitative material. Simply Wall St has no position in any stocks mentioned.
