
 Yahoo Finance
 Ditch Your Car: Here’s How Much It Costs To Live in the Top 50 Walkable Cities

Between fuel, repairs, maintenance, licensing, registration, insurance, initial purchase prices and monthly payments, the costs of owning a car can add up quickly. They also make walking or other forms of transportation a lot more attractive.
Car ownership costs topped $1,000 a month on average in 2023, according to AAA’s annual “Your Driving Costs” study. Based on AAA’s calculations, the average costs of owning and operating a new car came in at $12,182 last year. That’s nearly $1,500 more than the 2022 figure.
Be Aware: Car Experts Say Don’t Buy These 7 SUVs That Cost the Most Money Over Time
Try This: 6 Unusual Ways To Make Extra Money (That Actually Work)
Of course, you could try driving less or cutting costs in other ways, but the way to save the most on car expenses is to not have a car. For those looking to take that plunge while living in a large city, walkability is a key factor to consider. Ratings for public transit and bike-friendliness are also worth a look.
If you’re wondering how the nation’s most walkable major cities compare in terms of living costs, GOBankingRates has compiled a list based on information from WalkScore.com, Sperling’s Best Places, the Bureau of Labor Statistics, Zillow and other sources. Our full methodology is included at the end of this story.
Here’s our list of the 50 most walkable major U.S. cities, in reverse order (lowest score on the list to the nation’s most walkable large city). Along with each city’s walkability score, we’ve also included the livability score, total population, household median income, the average value of a single-family home, and the average total cost of living per month.

50. Des Moines, Iowa
Walkability score: 45.0
Livability score: 83
Population: 213,164
Household median income: $62,378
Single-family home average value: $207,190
Average total cost of living per month: $3,057
Good To Know: 5 Car Brands With the Most Reliable Engines
Find Out: 9 Most Reliable Cars To Buy Used in Summer 2024
Wealthy people know the best money secrets. Learn how to copy them.

49. San Bernadino, California
Walkability score: 45.0
Livability score: 58
Population: 221,041
Household median income: $61,323
Single-family home average value: $494,539
Average total cost of living per month: $4,988
Trending: I Have Driven Over 250 Car Models: These Are the 3 Best and Worst for Your Money
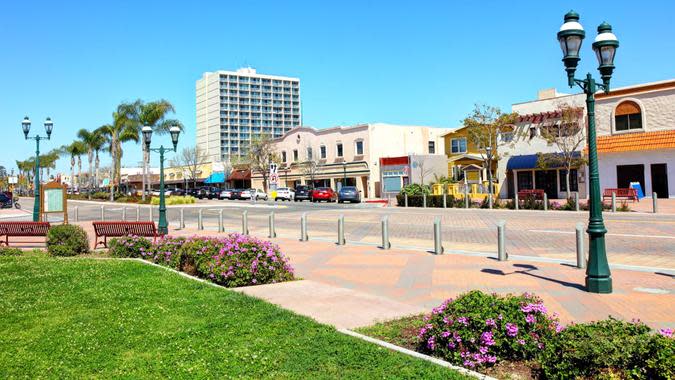
48. Chula Vista, California
Walkability score: 45.6
Livability score: 75
Population: 276,103
Household median income: $101,984
Single-family home average value: $910,139
Average total cost of living per month: $7,629

47. Norfolk, Virginia
Walkability score: 45.8
Livability score: 81
Population: 236,973
Household median income: $60,998
Single-family home average value: $299,407
Average total cost of living per month: $3,698
46. Dallas
Walkability score: 46.0
Livability score: 81
Population: 1,300,642
Household median income: $63,985
Single-family home average value: $335,719
Average total cost of living per month: $4,098

45. Toledo, Ohio
Walkability score: 46.4
Livability score: 66
Population: 269,962
Household median income: $45,405
Single-family home average value: $122,088
Average total cost of living per month: $2,543

44. Fresno, California
Walkability score: 46.6
Livability score: 63
Population: 541,528
Household median income: $63,001
Single-family home average value: $392,429
Average total cost of living per month: $4,371
Be Careful: 6 Hybrid Vehicles To Stay Away From Buying

43. Houston
Walkability score: 47.5
Livability score: 74
Population: 2,296,253
Household median income: $60,440
Single-family home average value: $277,482
Average total cost of living per month: $3,727

42. Atlanta
Walkability score: 47.7
Livability score: 78
Population: 494,838
Household median income: $77,655
Single-family home average value: $451,774
Average total cost of living per month: $4,833

41. Omaha, Nebraska
Walkability score: 48.2
Livability score: 83
Population: 489,201
Household median income: $70,202
Single-family home average value: $287,428
Average total cost of living per month: $3,688

40. Sacramento, California
Walkability score: 49.0
Livability score: 73
Population: 523,600
Household median income: $78,954
Single-family home average value: $494,806
Average total cost of living per month: $5,135

39. Cincinnati
Walkability score: 49.1
Livability score: 80
Population: 308,870
Household median income: $49,191
Single-family home average value: $248,973
Average total cost of living per month: $3,389
Discover More: 8 Best Luxury Cars for Wealthy Retirees

38. Spokane, Washington
Walkability score: 49.2
Livability score: 81
Population: 227,922
Household median income: $63,316
Single-family home average value: $399,826
Average total cost of living per month: $4,195
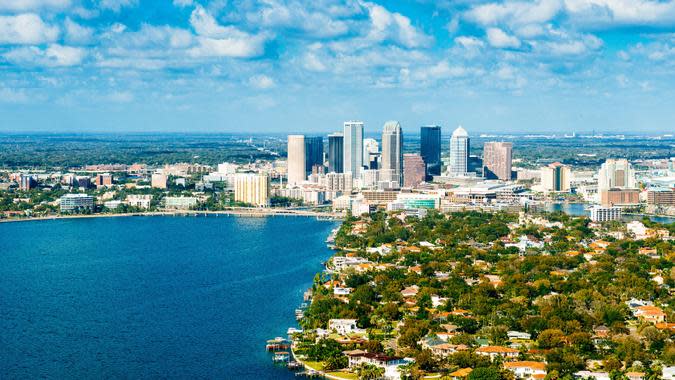
37. Tampa, Florida
Walkability score: 49.5
Livability score: 80
Population: 388,768
Household median income: $66,802
Single-family home average value: $402,743
Average total cost of living per month: $4,491
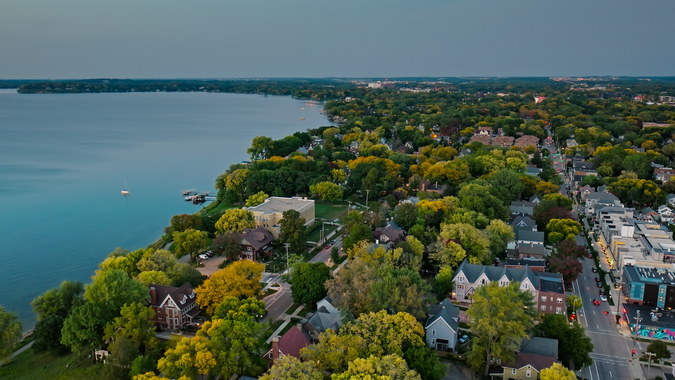
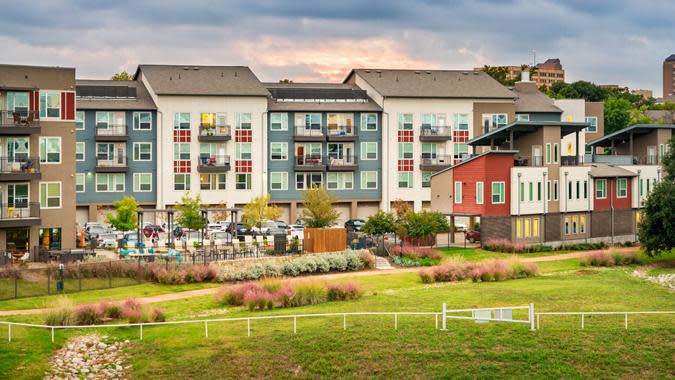
36. Madison, Wisconsin
Walkability score: 49.7
Livability score: 82
Population: 268,516
Household median income: $74,895
Single-family home average value: $428,576
Average total cost of living per month: $4,488

35. Fremont, California
Walkability score: 49.9
Livability score: 83
Population: 228,795
Household median income: $169,023
Single-family home average value: $1,691,318
Average total cost of living per month: $12,405
Trending Now: 10 Cars That Outlast the Average Vehicle

34. San Jose, California
Walkability score: 50.5
Livability score: 79
Population: 1,001,176
Household median income: $136,010
Single-family home average value: $1,583,499
Average total cost of living per month: $11,872
33. Richmond, Virginia
Walkability score: 50.9
Livability score: 84
Population: 227,171
Household median income: $59,606
Single-family home average value: $362,088
Average total cost of living per month: $4,080
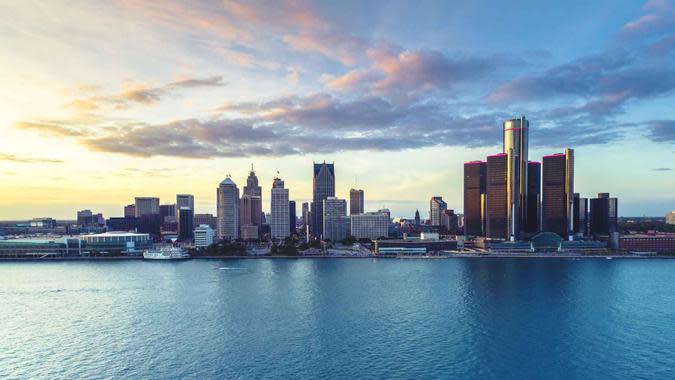
32. Detroit
Walkability score: 51.1
Livability score: 73
Population: 636,787
Household median income: $37,761
Single-family home average value: $70,984
Average total cost of living per month: $2,714

31. San Diego
Walkability score: 53.3
Livability score: 75
Population: 1,383,987
Household median income: $98,657
Single-family home average value: $1,164,577
Average total cost of living per month: $9,109
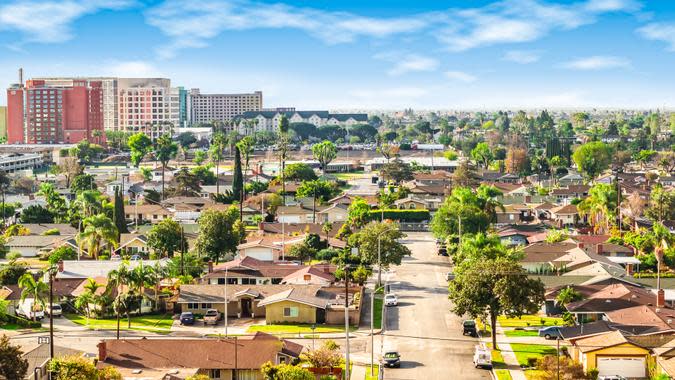
30. Anaheim, California
Walkability score: 55.7
Livability score: 69
Population: 347,111
Household median income: $88,538
Single-family home average value: $946,385
Average total cost of living per month: $7,764
Steer Clear: 10 New Cars To Avoid Buying in 2024
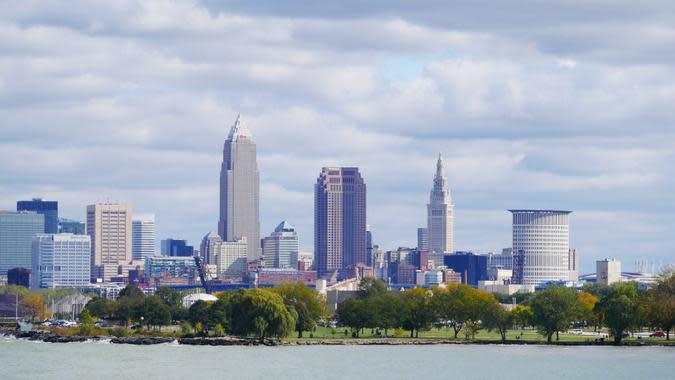
29. Cleveland
Walkability score: 57.1
Livability score: 72
Population: 370,365
Household median income: $37,271
Single-family home average value: $108,704
Average total cost of living per month: $2,474

28. New Orleans
Walkability score: 58.0
Livability score: 75
Population: 380,408
Household median income: $51,116
Single-family home average value: $241,955
Average total cost of living per month: $3,591

27. St. Paul, Minnesota
Walkability score: 60.4
Livability score: 80
Population: 308,806
Household median income: $69,919
Single-family home average value: $298,403
Average total cost of living per month: $3,749

26. Rochester, New York
Walkability score: 60.7
Livability score: 76
Population: 210,992
Household median income: $44,156
Single-family home average value: $224,955
Average total cost of living per month: $3,369

25. Denver
Walkability score: 61.2
Livability score: 72
Population: 710,800
Household median income: $85,853
Single-family home average value: $624,148
Average total cost of living per month: $5,777
For You: 4 Affordable Car Brands You Won’t Regret Buying in 2024

24. Milwaukee
Walkability score: 61.5
Livability score: 79
Population: 573,299
Household median income: $49,733
Single-family home average value: $210,315
Average total cost of living per month: $3,225

23. Pittsburgh
Walkability score: 62.4
Livability score: 84
Population: 303,843
Household median income: $60,187
Single-family home average value: $239,303
Average total cost of living per month: $3,443

22. Baltimore
Walkability score: 64.3
Livability score: 77
Population: 584,548
Household median income: $58,349
Single-family home average value: $187,384
Average total cost of living per month: $3,213

21. St. Louis
Walkability score: 65.7
Livability score: 74
Population: 298,018
Household median income: $52,941
Single-family home average value: $180,367
Average total cost of living per month: $2,995

20. Honolulu
Walkability score: 65.7
Livability score: NA
Population: 348,547
Household median income: $82,772
Single-family home average value: $1,300,650
Average total cost of living per month: $10,398
Find Out: What Is the Median Household Income for the Upper Middle Class in 2024?

19. Buffalo, New York
Walkability score: 66.6
Livability score: 79
Population: 276,688
Household median income: $46,184
Single-family home average value: $227,847
Average total cost of living per month: $3,447

18. Santa Ana, California
Walkability score: 67.1
Livability score: 51
Population: 311,379
Household median income: $84,210
Single-family home average value: $863,475
Average total cost of living per month: $7,238

17. Portland, Oregon
Walkability score: 67.3
Livability score: 78
Population: 646,101
Household median income: $85,876
Single-family home average value: $572,188
Average total cost of living per month: $5,517
16. Hialeah, Florida
Walkability score: 67.9
Livability score: 73
Population: 222,996
Household median income: $49,531
Single-family home average value: $554,520
Average total cost of living per month: $5,585

15. Los Angeles
Walkability score: 68.6
Livability score: 67
Population: 3,881,041
Household median income: $76,244
Single-family home average value: $1,036,868
Average total cost of living per month: $8,536
Trending Now: 6 Reasons the Poor Stay Poor and Middle Class Doesn’t Become Wealthy

14. Arlington, Virginia
Walkability score: 71.2
Livability score: 86
Population: 235,845
Household median income: $137,387
Single-family home average value: $1,033,462
Average total cost of living per month: $8,401

13. Minneapolis
Walkability score: 71.4
Livability score: 78
Population: 426,877
Household median income: $76,332
Single-family home average value: $345,471
Average total cost of living per month: $4,037

12. Long Beach, California
Walkability score: 73.3
Livability score: 69
Population: 462,293
Household median income: $78,995
Single-family home average value: $914,989
Average total cost of living per month: $7,753

11. Seattle
Walkability score: 74.4
Livability score: 75
Population: 734,603
Household median income: $116,068
Single-family home average value: $974,785
Average total cost of living per month: $7,938

10. Philadelphia
Walkability score: 74.8
Livability score: 76
Population: 1,593,208
Household median income: $57,537
Single-family home average value: $219,330
Average total cost of living per month: $3,614
Read Next: 5 Changes That Could Be Coming for the Middle Class If Biden Is Reelected in 2024

9. Oakland, California
Walkability score: 75.3
Livability score: 71
Population: 437,825
Household median income: $94,389
Single-family home average value: $883,451
Average total cost of living per month: $7,566

8. Newark, New Jersey
Walkability score: 75.9
Livability score: 67
Population: 307,355
Household median income: $46,460
Single-family home average value: $465,422
Average total cost of living per month: $5,178
7. Miami
Walkability score: 76.6
Livability score: 81
Population: 443,665
Household median income: $54,858
Single-family home average value: $640,456
Average total cost of living per month: $6,116

6. Washington, D.C.
Walkability score: 76.7
Livability score: 75
Population: 670,587
Household median income: $101,722
Single-family home average value: $732,079
Average total cost of living per month: $6,703

5. Chicago
Walkability score: 77.2
Livability score: 78
Population: 2,721,914
Household median income: $71,673
Single-family home average value: $309,435
Average total cost of living per month: $4,006
Find Out: Here’s the Living Wage a Single Person Needs To Live Comfortably in Arizona

4. Boston
Walkability score: 82.8
Livability score: 77
Population: 665,945
Household median income: $89,212
Single-family home average value: $810,728
Average total cost of living per month: $7,136

3. Jersey City, New Jersey
Walkability score: 86.6
Livability score: 82
Population: 287,899
Household median income: $91,151
Single-family home average value: $624,250
Average total cost of living per month: $6,127

2. New York City
Walkability score: 88.0
Livability score: 75
Population: 8,622,467
Household median income: $76,607
Single-family home average value: $775,516
Average total cost of living per month: $7,531

1. San Francisco
Walkability score: 88.7
Livability score: 75
Population: 851,036
Household median income: $136,689
Single-family home average value: $1,443,931
Average total cost of living per month: $11,139
Methodology: For this study, GOBankingRates reviewed the top 50 most walkable major U.S. cities and researched the cost of living in each one. First, GBR sourced walkability ratings from WalkScore.com. Cost-of-living indexes for each city were sourced from Sperling’s BestPlaces. The national average expenditure costs for all residents were sourced from the Bureau of Labor Statistics Consumer Expenditure Survey. The average single-family home value for May 2024 was sourced from the Zillow Home Value Index. By assuming a 10% down payment and using the national average 30-year fixed mortgage rate, the average mortgage costs were calculated. Average mortgage costs and average expenditure costs were combined to determine the total cost of living for each city. In addition, total population, total households and household median income were sourced from the U.S. Census American Community Survey. All data was collected and is up to date as of July 9, 2024.
More From GOBankingRates
I'm A Self-Made Millionaire: 6 Steps I Took To Become Rich On an Average Salary
I'm a Boomer Who's Driven Dozens of Car Models -- These Are the 5 Best for Your Retirement Dollar
6 Things to Try This Week if You're Behind on Your Savings Goals
4 Reasons Retired Women Need More Money Than Men -- And What To Do About it
This article originally appeared on GOBankingRates.com: Ditch Your Car: Here’s How Much It Costs To Live in the Top 50 Walkable Cities
