
 Yahoo Finance
 Dicker Data (ASX:DDR) Knows How To Allocate Capital
If we want to find a stock that could multiply over the long term, what are the underlying trends we should look for? One common approach is to try and find a company with returns on capital employed (ROCE) that are increasing, in conjunction with a growing amount of capital employed. If you see this, it typically means it's a company with a great business model and plenty of profitable reinvestment opportunities. With that in mind, the ROCE of Dicker Data (ASX:DDR) looks attractive right now, so lets see what the trend of returns can tell us.
Return On Capital Employed (ROCE): What Is It?
For those that aren't sure what ROCE is, it measures the amount of pre-tax profits a company can generate from the capital employed in its business. The formula for this calculation on Dicker Data is:
Return on Capital Employed = Earnings Before Interest and Tax (EBIT) ÷ (Total Assets - Current Liabilities)
0.49 = AU$136m ÷ (AU$927m - AU$648m) (Based on the trailing twelve months to December 2023).
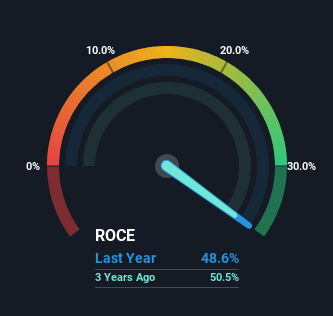
So, Dicker Data has an ROCE of 49%. In absolute terms that's a great return and it's even better than the Electronic industry average of 17%.
Check out our latest analysis for Dicker Data
In the above chart we have measured Dicker Data's prior ROCE against its prior performance, but the future is arguably more important. If you're interested, you can view the analysts predictions in our free analyst report for Dicker Data .
So How Is Dicker Data's ROCE Trending?
Dicker Data deserves to be commended in regards to it's returns. The company has employed 122% more capital in the last five years, and the returns on that capital have remained stable at 49%. Returns like this are the envy of most businesses and given it has repeatedly reinvested at these rates, that's even better. You'll see this when looking at well operated businesses or favorable business models.
On a side note, Dicker Data's current liabilities are still rather high at 70% of total assets. This can bring about some risks because the company is basically operating with a rather large reliance on its suppliers or other sorts of short-term creditors. While it's not necessarily a bad thing, it can be beneficial if this ratio is lower.
What We Can Learn From Dicker Data's ROCE
In short, we'd argue Dicker Data has the makings of a multi-bagger since its been able to compound its capital at very profitable rates of return. And the stock has done incredibly well with a 116% return over the last five years, so long term investors are no doubt ecstatic with that result. So while investors seem to be recognizing these promising trends, we still believe the stock deserves further research.
Dicker Data does come with some risks though, we found 2 warning signs in our investment analysis, and 1 of those shouldn't be ignored...
If you'd like to see other companies earning high returns, check out our free list of companies earning high returns with solid balance sheets here.
Have feedback on this article? Concerned about the content? Get in touch with us directly. Alternatively, email editorial-team (at) simplywallst.com.
This article by Simply Wall St is general in nature. We provide commentary based on historical data and analyst forecasts only using an unbiased methodology and our articles are not intended to be financial advice. It does not constitute a recommendation to buy or sell any stock, and does not take account of your objectives, or your financial situation. We aim to bring you long-term focused analysis driven by fundamental data. Note that our analysis may not factor in the latest price-sensitive company announcements or qualitative material. Simply Wall St has no position in any stocks mentioned.
Have feedback on this article? Concerned about the content? Get in touch with us directly. Alternatively, email editorial-team@simplywallst.com
