
 Yahoo Finance
 DexCom (NASDAQ:DXCM) shareholders have earned a 26% CAGR over the last five years
It hasn't been the best quarter for DexCom, Inc. (NASDAQ:DXCM) shareholders, since the share price has fallen 18% in that time. But that scarcely detracts from the really solid long term returns generated by the company over five years. Indeed, the share price is up an impressive 217% in that time. We think it's more important to dwell on the long term returns than the short term returns. The more important question is whether the stock is too cheap or too expensive today.
So let's investigate and see if the longer term performance of the company has been in line with the underlying business' progress.
View our latest analysis for DexCom
To quote Buffett, 'Ships will sail around the world but the Flat Earth Society will flourish. There will continue to be wide discrepancies between price and value in the marketplace...' One imperfect but simple way to consider how the market perception of a company has shifted is to compare the change in the earnings per share (EPS) with the share price movement.
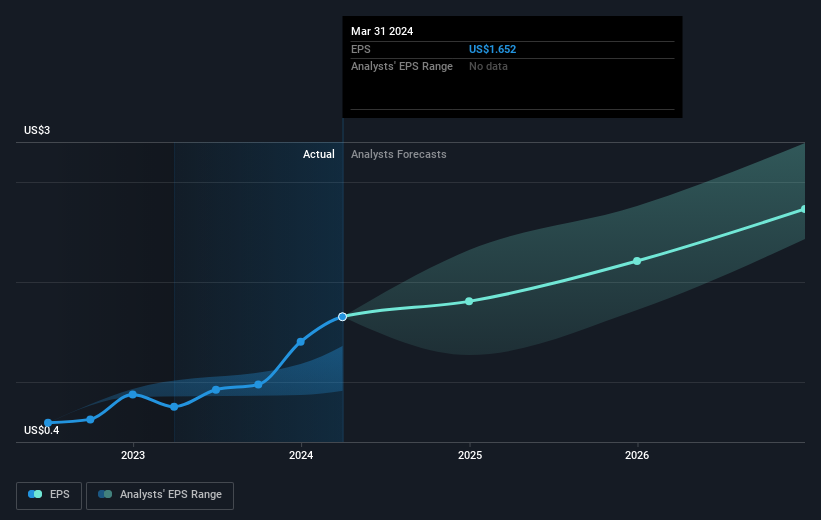
During the last half decade, DexCom became profitable. That kind of transition can be an inflection point that justifies a strong share price gain, just as we have seen here. Since the company was unprofitable five years ago, but not three years ago, it's worth taking a look at the returns in the last three years, too. Indeed, the DexCom share price has gained 6.3% in three years. During the same period, EPS grew by 5.0% each year. This EPS growth is higher than the 2.1% average annual increase in the share price over the same three years. Therefore, it seems the market has moderated its expectations for growth, somewhat. Having said that, the market is still optimistic, given the P/E ratio of 70.61.
The company's earnings per share (over time) is depicted in the image below (click to see the exact numbers).
We know that DexCom has improved its bottom line lately, but is it going to grow revenue? You could check out this free report showing analyst revenue forecasts.
A Different Perspective
DexCom shareholders are down 10% for the year, but the market itself is up 25%. However, keep in mind that even the best stocks will sometimes underperform the market over a twelve month period. On the bright side, long term shareholders have made money, with a gain of 26% per year over half a decade. It could be that the recent sell-off is an opportunity, so it may be worth checking the fundamental data for signs of a long term growth trend. It's always interesting to track share price performance over the longer term. But to understand DexCom better, we need to consider many other factors. Even so, be aware that DexCom is showing 1 warning sign in our investment analysis , you should know about...
Of course DexCom may not be the best stock to buy. So you may wish to see this free collection of growth stocks.
Please note, the market returns quoted in this article reflect the market weighted average returns of stocks that currently trade on American exchanges.
Have feedback on this article? Concerned about the content? Get in touch with us directly. Alternatively, email editorial-team (at) simplywallst.com.
This article by Simply Wall St is general in nature. We provide commentary based on historical data and analyst forecasts only using an unbiased methodology and our articles are not intended to be financial advice. It does not constitute a recommendation to buy or sell any stock, and does not take account of your objectives, or your financial situation. We aim to bring you long-term focused analysis driven by fundamental data. Note that our analysis may not factor in the latest price-sensitive company announcements or qualitative material. Simply Wall St has no position in any stocks mentioned.
Have feedback on this article? Concerned about the content? Get in touch with us directly. Alternatively, email editorial-team@simplywallst.com
