
 Yahoo Finance
 Dewhurst Group Plc's (LON:DWHT) Subdued P/E Might Signal An Opportunity
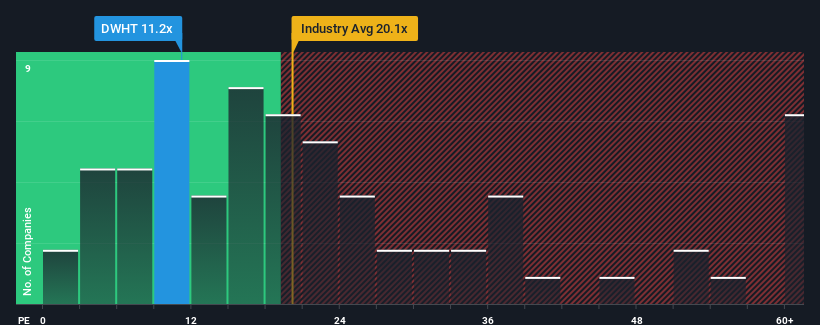
With a price-to-earnings (or "P/E") ratio of 11.2x Dewhurst Group Plc (LON:DWHT) may be sending bullish signals at the moment, given that almost half of all companies in the United Kingdom have P/E ratios greater than 16x and even P/E's higher than 28x are not unusual. However, the P/E might be low for a reason and it requires further investigation to determine if it's justified.
As an illustration, earnings have deteriorated at Dewhurst Group over the last year, which is not ideal at all. One possibility is that the P/E is low because investors think the company won't do enough to avoid underperforming the broader market in the near future. However, if this doesn't eventuate then existing shareholders may be feeling optimistic about the future direction of the share price.
Check out our latest analysis for Dewhurst Group
Want the full picture on earnings, revenue and cash flow for the company? Then our free report on Dewhurst Group will help you shine a light on its historical performance.
How Is Dewhurst Group's Growth Trending?
In order to justify its P/E ratio, Dewhurst Group would need to produce sluggish growth that's trailing the market.
Retrospectively, the last year delivered a frustrating 28% decrease to the company's bottom line. Even so, admirably EPS has lifted 100% in aggregate from three years ago, notwithstanding the last 12 months. So we can start by confirming that the company has generally done a very good job of growing earnings over that time, even though it had some hiccups along the way.
Comparing that to the market, which is only predicted to deliver 13% growth in the next 12 months, the company's momentum is stronger based on recent medium-term annualised earnings results.
With this information, we find it odd that Dewhurst Group is trading at a P/E lower than the market. It looks like most investors are not convinced the company can maintain its recent growth rates.
The Key Takeaway
While the price-to-earnings ratio shouldn't be the defining factor in whether you buy a stock or not, it's quite a capable barometer of earnings expectations.
We've established that Dewhurst Group currently trades on a much lower than expected P/E since its recent three-year growth is higher than the wider market forecast. There could be some major unobserved threats to earnings preventing the P/E ratio from matching this positive performance. At least price risks look to be very low if recent medium-term earnings trends continue, but investors seem to think future earnings could see a lot of volatility.
Don't forget that there may be other risks. For instance, we've identified 2 warning signs for Dewhurst Group that you should be aware of.
Of course, you might also be able to find a better stock than Dewhurst Group. So you may wish to see this free collection of other companies that have reasonable P/E ratios and have grown earnings strongly.
Have feedback on this article? Concerned about the content? Get in touch with us directly. Alternatively, email editorial-team (at) simplywallst.com.
This article by Simply Wall St is general in nature. We provide commentary based on historical data and analyst forecasts only using an unbiased methodology and our articles are not intended to be financial advice. It does not constitute a recommendation to buy or sell any stock, and does not take account of your objectives, or your financial situation. We aim to bring you long-term focused analysis driven by fundamental data. Note that our analysis may not factor in the latest price-sensitive company announcements or qualitative material. Simply Wall St has no position in any stocks mentioned.
