
 Yahoo Finance
 Despite shrinking by US$1.6b in the past week, NRG Energy (NYSE:NRG) shareholders are still up 144% over 1 year
When you buy shares in a company, there is always a risk that the price drops to zero. But if you pick the right business to buy shares in, you can make more than you can lose. For example, the NRG Energy, Inc. (NYSE:NRG) share price had more than doubled in just one year - up 137%. It's also good to see the share price up 31% over the last quarter. It is also impressive that the stock is up 127% over three years, adding to the sense that it is a real winner.
Since the long term performance has been good but there's been a recent pullback of 8.9%, let's check if the fundamentals match the share price.
View our latest analysis for NRG Energy
To paraphrase Benjamin Graham: Over the short term the market is a voting machine, but over the long term it's a weighing machine. One flawed but reasonable way to assess how sentiment around a company has changed is to compare the earnings per share (EPS) with the share price.
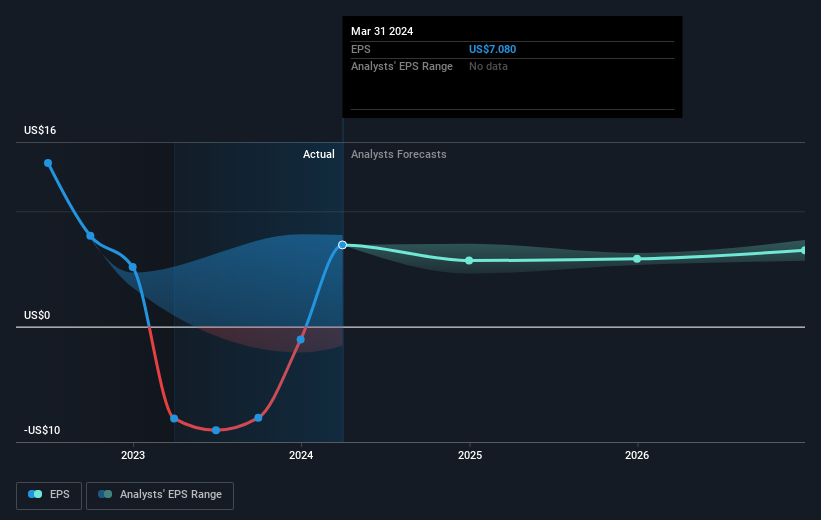
During the last year NRG Energy grew its earnings per share, moving from a loss to a profit.
We think the growth looks very prospective, so we're not surprised the market liked it too. Inflection points like this can be a great time to take a closer look at a company.
The image below shows how EPS has tracked over time (if you click on the image you can see greater detail).
It is of course excellent to see how NRG Energy has grown profits over the years, but the future is more important for shareholders. You can see how its balance sheet has strengthened (or weakened) over time in this free interactive graphic.
What About Dividends?
As well as measuring the share price return, investors should also consider the total shareholder return (TSR). Whereas the share price return only reflects the change in the share price, the TSR includes the value of dividends (assuming they were reinvested) and the benefit of any discounted capital raising or spin-off. It's fair to say that the TSR gives a more complete picture for stocks that pay a dividend. In the case of NRG Energy, it has a TSR of 144% for the last 1 year. That exceeds its share price return that we previously mentioned. The dividends paid by the company have thusly boosted the total shareholder return.
A Different Perspective
It's nice to see that NRG Energy shareholders have received a total shareholder return of 144% over the last year. Of course, that includes the dividend. That gain is better than the annual TSR over five years, which is 22%. Therefore it seems like sentiment around the company has been positive lately. In the best case scenario, this may hint at some real business momentum, implying that now could be a great time to delve deeper. While it is well worth considering the different impacts that market conditions can have on the share price, there are other factors that are even more important. To that end, you should learn about the 4 warning signs we've spotted with NRG Energy (including 2 which don't sit too well with us) .
Of course NRG Energy may not be the best stock to buy. So you may wish to see this free collection of growth stocks.
Please note, the market returns quoted in this article reflect the market weighted average returns of stocks that currently trade on American exchanges.
Have feedback on this article? Concerned about the content? Get in touch with us directly. Alternatively, email editorial-team (at) simplywallst.com.
This article by Simply Wall St is general in nature. We provide commentary based on historical data and analyst forecasts only using an unbiased methodology and our articles are not intended to be financial advice. It does not constitute a recommendation to buy or sell any stock, and does not take account of your objectives, or your financial situation. We aim to bring you long-term focused analysis driven by fundamental data. Note that our analysis may not factor in the latest price-sensitive company announcements or qualitative material. Simply Wall St has no position in any stocks mentioned.
