
 Yahoo Finance
 Crestwood (CEQP) Q2 Earnings Beat on Storage and Logistics
Crestwood Equity Partners LP CEQP reported second-quarter 2023 adjusted earnings of $1.16 per unit, surpassing the Zacks Consensus Estimate of 26 cents. The bottom line jumped from the year-ago quarter’s profit of 14 cents per unit.
Total quarterly revenues declined to $1,021.2 million from $1,448 million in the prior-year quarter. The top line missed the Zacks Consensus Estimate of $1,194.3 million.
Strong quarterly earnings were owing to fantastic contributions from the Storage and Logistics business unit. This was hurt partially by lower gas-gathering volumes from the Williston Basin.
Crestwood Equity Partners LP Price, Consensus and EPS Surprise
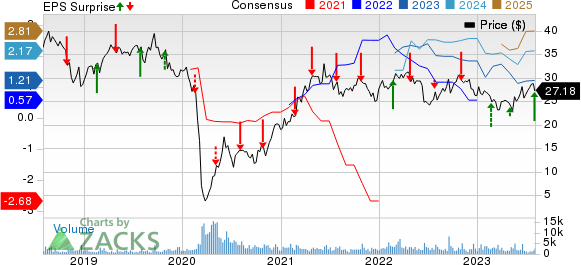
Crestwood Equity Partners LP price-consensus-eps-surprise-chart | Crestwood Equity Partners LP Quote
Segmental Performance
Gathering and Processing North: The segment of Crestwood generated earnings before interest, taxes, depreciation and amortization (EBITDA) of $136.7 million, down from $152.7 million in the year-ago quarter. Our estimate for the business unit also suggests a year-over-year decline. Operating and maintenance expenses decreased to $26.4 million from $27.5 million.
Total gas gathering volumes in the quarter were 330.6 million cubic feet per day (MMcf/d), down from 348.6 MMcf/d a year ago. Gathering volumes decreased in the Williston Basin and the Powder River Basin. Total processing volumes fell to 349.8 MMcf/d from the year-ago level of 374.4 MMcf/d.
Gathering and Processing South: The segment generated earnings of $35.2 million, up from $24.8 million reported in the year-ago quarter. Operating and maintenance expenses increased to $15.2 million from $7.6 million.
Total gas gathering volumes in the quarter were 535 MMcf/d, down from 691 MMcf/d a year ago. Total processing volumes increased to 443.8 MMcf/d from the year-ago level of 220.2 MMcf/d.
Storage and Logistics: The segment generated earnings of $142 million, which jumped from $9.5 million in the year-ago quarter. Our estimate also reflects a significant year-over-year rise. Operating and maintenance expenses of $11.6 million increased marginally from the year-ago quarter’s $11.5 million.
Expenses
Total operating expenses and others increased to $161.1 million from $160.9 million in the year-ago period.
Operation and maintenance costs increased to $53.2 million from $46.6 million a year ago. However, general and administrative expenses declined to $25 million from $26.5 million.
Cash Flow
Distributable cash flow attributable to CEQP common in the second quarter was $86.4 million, down from $108.1 million in the year-ago period. Our estimate for the metric was $96.7 million.
Free cash flow after distributions was $18.3 million deficit in the June quarter compared with $1.3 million in the year-ago period.
Balance Sheet
As of Jun 30, 2023, Crestwood had $7.7 million in cash. Total debt was $3,259.1 million at the second-quarter end.
Guidance
For this year, the partnership projects adjusted EBITDA in the band of $780 million to $860 million. However, due to the lower commodity pricing environment, Crestwood believes that the metric will be within the lower half of the range.
Zacks Rank & Other Stocks to Consider
Crestwood currently carries a Zacks Rank #2 (Buy). Other prospective players in the energy space include Evolution Petroleum Corporation EPM, Oceaneering International, Inc. OII and Murphy USA MUSA. All the stocks sport a Zacks Rank #1 (Strong Buy).
You can see the complete list of today’s Zacks #1 Rank stocks here.
Through its ownership interests in onshore oil and natural gas properties in the United States, Evolution Petroleum is touted as a key independent energy player.
Oceaneering International is well placed on improving oil prices since it is a leading provider of engineered services and products and robotic solutions to the energy companies working offshore. Higher oil price is supporting increased upstream activities, which, in turn, will improve demand for Oceaneering’s drilling and completions support services.
Murphy, a leading retailer of gasoline and convenience merchandise, has a solid business model.
Want the latest recommendations from Zacks Investment Research? Today, you can download 7 Best Stocks for the Next 30 Days. Click to get this free report
Oceaneering International, Inc. (OII) : Free Stock Analysis Report
Murphy USA Inc. (MUSA) : Free Stock Analysis Report
Evolution Petroleum Corporation, Inc. (EPM) : Free Stock Analysis Report
Crestwood Equity Partners LP (CEQP) : Free Stock Analysis Report
