
 Yahoo Finance
 Coupang (NYSE:CPNG) Might Have The Makings Of A Multi-Bagger
If we want to find a stock that could multiply over the long term, what are the underlying trends we should look for? Typically, we'll want to notice a trend of growing return on capital employed (ROCE) and alongside that, an expanding base of capital employed. Ultimately, this demonstrates that it's a business that is reinvesting profits at increasing rates of return. Speaking of which, we noticed some great changes in Coupang's (NYSE:CPNG) returns on capital, so let's have a look.
What Is Return On Capital Employed (ROCE)?
Just to clarify if you're unsure, ROCE is a metric for evaluating how much pre-tax income (in percentage terms) a company earns on the capital invested in its business. The formula for this calculation on Coupang is:
Return on Capital Employed = Earnings Before Interest and Tax (EBIT) ÷ (Total Assets - Current Liabilities)
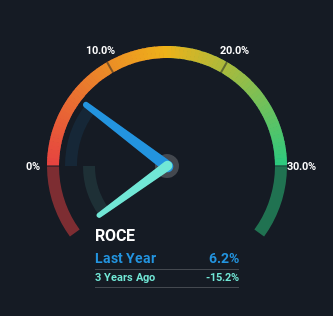
0.062 = US$464m ÷ (US$15b - US$7.4b) (Based on the trailing twelve months to March 2024).
Thus, Coupang has an ROCE of 6.2%. In absolute terms, that's a low return and it also under-performs the Multiline Retail industry average of 11%.
See our latest analysis for Coupang
Above you can see how the current ROCE for Coupang compares to its prior returns on capital, but there's only so much you can tell from the past. If you're interested, you can view the analysts predictions in our free analyst report for Coupang .
What Does the ROCE Trend For Coupang Tell Us?
Coupang has recently broken into profitability so their prior investments seem to be paying off. Shareholders would no doubt be pleased with this because the business was loss-making five years ago but is is now generating 6.2% on its capital. Not only that, but the company is utilizing 1,707% more capital than before, but that's to be expected from a company trying to break into profitability. We like this trend, because it tells us the company has profitable reinvestment opportunities available to it, and if it continues going forward that can lead to a multi-bagger performance.
One more thing to note, Coupang has decreased current liabilities to 50% of total assets over this period, which effectively reduces the amount of funding from suppliers or short-term creditors. This tells us that Coupang has grown its returns without a reliance on increasing their current liabilities, which we're very happy with. However, current liabilities are still at a pretty high level, so just be aware that this can bring with it some risks.
Our Take On Coupang's ROCE
In summary, it's great to see that Coupang has managed to break into profitability and is continuing to reinvest in its business. Astute investors may have an opportunity here because the stock has declined 45% in the last three years. With that in mind, we believe the promising trends warrant this stock for further investigation.
If you'd like to know about the risks facing Coupang, we've discovered 1 warning sign that you should be aware of.
If you want to search for solid companies with great earnings, check out this free list of companies with good balance sheets and impressive returns on equity.
Have feedback on this article? Concerned about the content? Get in touch with us directly. Alternatively, email editorial-team (at) simplywallst.com.
This article by Simply Wall St is general in nature. We provide commentary based on historical data and analyst forecasts only using an unbiased methodology and our articles are not intended to be financial advice. It does not constitute a recommendation to buy or sell any stock, and does not take account of your objectives, or your financial situation. We aim to bring you long-term focused analysis driven by fundamental data. Note that our analysis may not factor in the latest price-sensitive company announcements or qualitative material. Simply Wall St has no position in any stocks mentioned.
