
 Yahoo Finance
 Computer Modelling Group Ltd.'s (TSE:CMG) P/E Still Appears To Be Reasonable
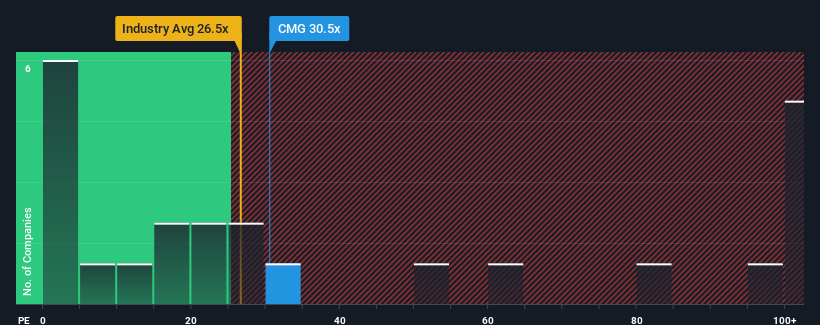
With a price-to-earnings (or "P/E") ratio of 30.5x Computer Modelling Group Ltd. (TSE:CMG) may be sending very bearish signals at the moment, given that almost half of all companies in Canada have P/E ratios under 12x and even P/E's lower than 5x are not unusual. However, the P/E might be quite high for a reason and it requires further investigation to determine if it's justified.
Recent times have been pleasing for Computer Modelling Group as its earnings have risen in spite of the market's earnings going into reverse. It seems that many are expecting the company to continue defying the broader market adversity, which has increased investors’ willingness to pay up for the stock. You'd really hope so, otherwise you're paying a pretty hefty price for no particular reason.
Check out our latest analysis for Computer Modelling Group
If you'd like to see what analysts are forecasting going forward, you should check out our free report on Computer Modelling Group.
What Are Growth Metrics Telling Us About The High P/E?
Computer Modelling Group's P/E ratio would be typical for a company that's expected to deliver very strong growth, and importantly, perform much better than the market.
If we review the last year of earnings growth, the company posted a terrific increase of 33%. As a result, it also grew EPS by 12% in total over the last three years. Therefore, it's fair to say the earnings growth recently has been respectable for the company.
Looking ahead now, EPS is anticipated to climb by 22% during the coming year according to the four analysts following the company. That's shaping up to be materially higher than the 12% growth forecast for the broader market.
In light of this, it's understandable that Computer Modelling Group's P/E sits above the majority of other companies. Apparently shareholders aren't keen to offload something that is potentially eyeing a more prosperous future.
What We Can Learn From Computer Modelling Group's P/E?
While the price-to-earnings ratio shouldn't be the defining factor in whether you buy a stock or not, it's quite a capable barometer of earnings expectations.
We've established that Computer Modelling Group maintains its high P/E on the strength of its forecast growth being higher than the wider market, as expected. At this stage investors feel the potential for a deterioration in earnings isn't great enough to justify a lower P/E ratio. Unless these conditions change, they will continue to provide strong support to the share price.
Before you take the next step, you should know about the 2 warning signs for Computer Modelling Group that we have uncovered.
Of course, you might also be able to find a better stock than Computer Modelling Group. So you may wish to see this free collection of other companies that have reasonable P/E ratios and have grown earnings strongly.
Have feedback on this article? Concerned about the content? Get in touch with us directly. Alternatively, email editorial-team (at) simplywallst.com.
This article by Simply Wall St is general in nature. We provide commentary based on historical data and analyst forecasts only using an unbiased methodology and our articles are not intended to be financial advice. It does not constitute a recommendation to buy or sell any stock, and does not take account of your objectives, or your financial situation. We aim to bring you long-term focused analysis driven by fundamental data. Note that our analysis may not factor in the latest price-sensitive company announcements or qualitative material. Simply Wall St has no position in any stocks mentioned.
