
 Yahoo Finance
 Chemed Corporation (NYSE:CHE) Not Lagging Market On Growth Or Pricing
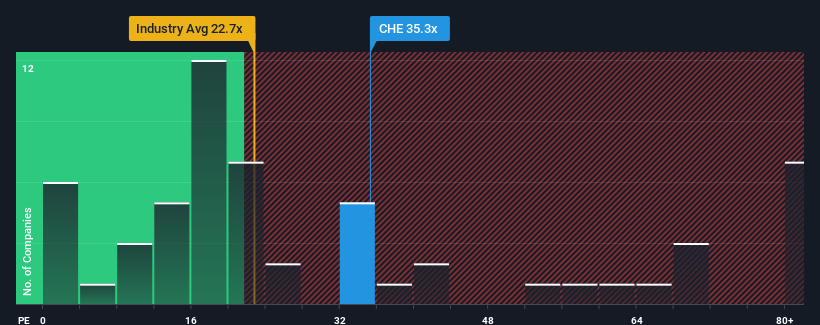
With a price-to-earnings (or "P/E") ratio of 35.3x Chemed Corporation (NYSE:CHE) may be sending very bearish signals at the moment, given that almost half of all companies in the United States have P/E ratios under 16x and even P/E's lower than 9x are not unusual. Nonetheless, we'd need to dig a little deeper to determine if there is a rational basis for the highly elevated P/E.
With earnings that are retreating more than the market's of late, Chemed has been very sluggish. It might be that many expect the dismal earnings performance to recover substantially, which has kept the P/E from collapsing. If not, then existing shareholders may be very nervous about the viability of the share price.
See our latest analysis for Chemed
If you'd like to see what analysts are forecasting going forward, you should check out our free report on Chemed.
What Are Growth Metrics Telling Us About The High P/E?
The only time you'd be truly comfortable seeing a P/E as steep as Chemed's is when the company's growth is on track to outshine the market decidedly.
Retrospectively, the last year delivered a frustrating 6.6% decrease to the company's bottom line. As a result, earnings from three years ago have also fallen 4.1% overall. Accordingly, shareholders would have felt downbeat about the medium-term rates of earnings growth.
Looking ahead now, EPS is anticipated to climb by 23% during the coming year according to the three analysts following the company. Meanwhile, the rest of the market is forecast to only expand by 10%, which is noticeably less attractive.
With this information, we can see why Chemed is trading at such a high P/E compared to the market. Apparently shareholders aren't keen to offload something that is potentially eyeing a more prosperous future.
The Final Word
While the price-to-earnings ratio shouldn't be the defining factor in whether you buy a stock or not, it's quite a capable barometer of earnings expectations.
As we suspected, our examination of Chemed's analyst forecasts revealed that its superior earnings outlook is contributing to its high P/E. Right now shareholders are comfortable with the P/E as they are quite confident future earnings aren't under threat. It's hard to see the share price falling strongly in the near future under these circumstances.
Before you take the next step, you should know about the 1 warning sign for Chemed that we have uncovered.
If you're unsure about the strength of Chemed's business, why not explore our interactive list of stocks with solid business fundamentals for some other companies you may have missed.
Have feedback on this article? Concerned about the content? Get in touch with us directly. Alternatively, email editorial-team (at) simplywallst.com.
This article by Simply Wall St is general in nature. We provide commentary based on historical data and analyst forecasts only using an unbiased methodology and our articles are not intended to be financial advice. It does not constitute a recommendation to buy or sell any stock, and does not take account of your objectives, or your financial situation. We aim to bring you long-term focused analysis driven by fundamental data. Note that our analysis may not factor in the latest price-sensitive company announcements or qualitative material. Simply Wall St has no position in any stocks mentioned.
