
 Yahoo Finance
 CHAR Technologies Ltd.'s (CVE:YES) Profit Outlook
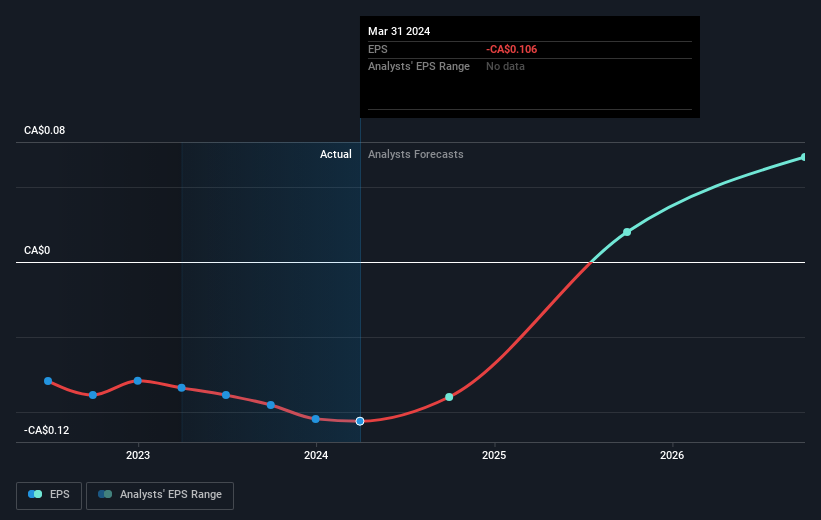
We feel now is a pretty good time to analyse CHAR Technologies Ltd.'s (CVE:YES) business as it appears the company may be on the cusp of a considerable accomplishment. CHAR Technologies Ltd., a cleantech development and services company, engages in the conversion of organic waste into renewable gases and biocarbon products. The company’s loss has recently broadened since it announced a CA$8.4m loss in the full financial year, compared to the latest trailing-twelve-month loss of CA$10m, moving it further away from breakeven. As path to profitability is the topic on CHAR Technologies' investors mind, we've decided to gauge market sentiment. In this article, we will touch on the expectations for the company's growth and when analysts expect it to become profitable.
Check out our latest analysis for CHAR Technologies
According to some industry analysts covering CHAR Technologies, breakeven is near. They expect the company to post a final loss in 2024, before turning a profit of CA$3.5m in 2025. Therefore, the company is expected to breakeven just over a year from now. What rate will the company have to grow year-on-year in order to breakeven on this date? Using a line of best fit, we calculated an average annual growth rate of 62%, which is rather optimistic! Should the business grow at a slower rate, it will become profitable at a later date than expected.
Underlying developments driving CHAR Technologies' growth isn’t the focus of this broad overview, however, bear in mind that by and large a high growth rate is not out of the ordinary, particularly when a company is in a period of investment.
One thing we would like to bring into light with CHAR Technologies is its relatively high level of debt. Typically, debt shouldn’t exceed 40% of your equity, which in CHAR Technologies' case is 80%. Note that a higher debt obligation increases the risk in investing in the loss-making company.
Next Steps:
This article is not intended to be a comprehensive analysis on CHAR Technologies, so if you are interested in understanding the company at a deeper level, take a look at CHAR Technologies' company page on Simply Wall St. We've also compiled a list of important aspects you should look at:
Historical Track Record: What has CHAR Technologies' performance been like over the past? Go into more detail in the past track record analysis and take a look at the free visual representations of our analysis for more clarity.
Management Team: An experienced management team on the helm increases our confidence in the business – take a look at who sits on CHAR Technologies' board and the CEO’s background.
Other High-Performing Stocks: Are there other stocks that provide better prospects with proven track records? Explore our free list of these great stocks here.
Have feedback on this article? Concerned about the content? Get in touch with us directly. Alternatively, email editorial-team (at) simplywallst.com.
This article by Simply Wall St is general in nature. We provide commentary based on historical data and analyst forecasts only using an unbiased methodology and our articles are not intended to be financial advice. It does not constitute a recommendation to buy or sell any stock, and does not take account of your objectives, or your financial situation. We aim to bring you long-term focused analysis driven by fundamental data. Note that our analysis may not factor in the latest price-sensitive company announcements or qualitative material. Simply Wall St has no position in any stocks mentioned.
Have feedback on this article? Concerned about the content? Get in touch with us directly. Alternatively, email editorial-team@simplywallst.com
