
 Yahoo Finance
 Century Communities' (NYSE:CCS) five-year total shareholder returns outpace the underlying earnings growth
When you buy a stock there is always a possibility that it could drop 100%. But on a lighter note, a good company can see its share price rise well over 100%. Long term Century Communities, Inc. (NYSE:CCS) shareholders would be well aware of this, since the stock is up 217% in five years. Unfortunately, though, the stock has dropped 6.5% over a week. But note that the broader market is down 0.2% since last week, and this may have impacted Century Communities' share price.
Since the long term performance has been good but there's been a recent pullback of 6.5%, let's check if the fundamentals match the share price.
See our latest analysis for Century Communities
To paraphrase Benjamin Graham: Over the short term the market is a voting machine, but over the long term it's a weighing machine. By comparing earnings per share (EPS) and share price changes over time, we can get a feel for how investor attitudes to a company have morphed over time.
During five years of share price growth, Century Communities achieved compound earnings per share (EPS) growth of 24% per year. So the EPS growth rate is rather close to the annualized share price gain of 26% per year. This indicates that investor sentiment towards the company has not changed a great deal. Indeed, it would appear the share price is reacting to the EPS.
You can see how EPS has changed over time in the image below (click on the chart to see the exact values).
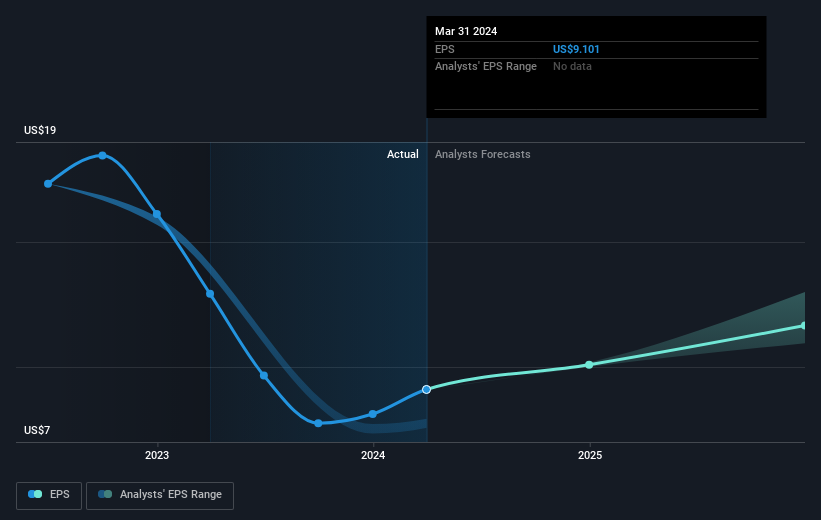
Dive deeper into Century Communities' key metrics by checking this interactive graph of Century Communities's earnings, revenue and cash flow.
What About Dividends?
As well as measuring the share price return, investors should also consider the total shareholder return (TSR). The TSR incorporates the value of any spin-offs or discounted capital raisings, along with any dividends, based on the assumption that the dividends are reinvested. It's fair to say that the TSR gives a more complete picture for stocks that pay a dividend. As it happens, Century Communities' TSR for the last 5 years was 229%, which exceeds the share price return mentioned earlier. This is largely a result of its dividend payments!
A Different Perspective
Century Communities' TSR for the year was broadly in line with the market average, at 33%. Most would be happy with a gain, and it helps that the year's return is actually better than the average return over five years, which was 27%. It is possible that management foresight will bring growth well into the future, even if the share price slows down. I find it very interesting to look at share price over the long term as a proxy for business performance. But to truly gain insight, we need to consider other information, too. Take risks, for example - Century Communities has 1 warning sign we think you should be aware of.
Of course Century Communities may not be the best stock to buy. So you may wish to see this free collection of growth stocks.
Please note, the market returns quoted in this article reflect the market weighted average returns of stocks that currently trade on American exchanges.
Have feedback on this article? Concerned about the content? Get in touch with us directly. Alternatively, email editorial-team (at) simplywallst.com.
This article by Simply Wall St is general in nature. We provide commentary based on historical data and analyst forecasts only using an unbiased methodology and our articles are not intended to be financial advice. It does not constitute a recommendation to buy or sell any stock, and does not take account of your objectives, or your financial situation. We aim to bring you long-term focused analysis driven by fundamental data. Note that our analysis may not factor in the latest price-sensitive company announcements or qualitative material. Simply Wall St has no position in any stocks mentioned.
