
 Yahoo Finance
 Capital Allocation Trends At Wynnstay Group (LON:WYN) Aren't Ideal
There are a few key trends to look for if we want to identify the next multi-bagger. Firstly, we'll want to see a proven return on capital employed (ROCE) that is increasing, and secondly, an expanding base of capital employed. If you see this, it typically means it's a company with a great business model and plenty of profitable reinvestment opportunities. Although, when we looked at Wynnstay Group (LON:WYN), it didn't seem to tick all of these boxes.
Understanding Return On Capital Employed (ROCE)
If you haven't worked with ROCE before, it measures the 'return' (pre-tax profit) a company generates from capital employed in its business. The formula for this calculation on Wynnstay Group is:
Return on Capital Employed = Earnings Before Interest and Tax (EBIT) ÷ (Total Assets - Current Liabilities)
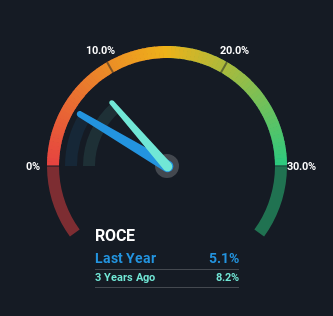
0.051 = UK£7.8m ÷ (UK£238m - UK£86m) (Based on the trailing twelve months to April 2024).
Therefore, Wynnstay Group has an ROCE of 5.1%. In absolute terms, that's a low return and it also under-performs the Food industry average of 12%.
See our latest analysis for Wynnstay Group
Above you can see how the current ROCE for Wynnstay Group compares to its prior returns on capital, but there's only so much you can tell from the past. If you'd like to see what analysts are forecasting going forward, you should check out our free analyst report for Wynnstay Group .
The Trend Of ROCE
On the surface, the trend of ROCE at Wynnstay Group doesn't inspire confidence. To be more specific, ROCE has fallen from 8.9% over the last five years. And considering revenue has dropped while employing more capital, we'd be cautious. This could mean that the business is losing its competitive advantage or market share, because while more money is being put into ventures, it's actually producing a lower return - "less bang for their buck" per se.
The Key Takeaway
From the above analysis, we find it rather worrisome that returns on capital and sales for Wynnstay Group have fallen, meanwhile the business is employing more capital than it was five years ago. Investors must expect better things on the horizon though because the stock has risen 39% in the last five years. Regardless, we don't like the trends as they are and if they persist, we think you might find better investments elsewhere.
On a final note, we've found 2 warning signs for Wynnstay Group that we think you should be aware of.
If you want to search for solid companies with great earnings, check out this free list of companies with good balance sheets and impressive returns on equity.
Have feedback on this article? Concerned about the content? Get in touch with us directly. Alternatively, email editorial-team (at) simplywallst.com.
This article by Simply Wall St is general in nature. We provide commentary based on historical data and analyst forecasts only using an unbiased methodology and our articles are not intended to be financial advice. It does not constitute a recommendation to buy or sell any stock, and does not take account of your objectives, or your financial situation. We aim to bring you long-term focused analysis driven by fundamental data. Note that our analysis may not factor in the latest price-sensitive company announcements or qualitative material. Simply Wall St has no position in any stocks mentioned.
Have feedback on this article? Concerned about the content? Get in touch with us directly. Alternatively, email editorial-team@simplywallst.com
