
 Yahoo Finance
 Capital Allocation Trends At Verizon Communications (NYSE:VZ) Aren't Ideal
There are a few key trends to look for if we want to identify the next multi-bagger. Firstly, we'll want to see a proven return on capital employed (ROCE) that is increasing, and secondly, an expanding base of capital employed. Ultimately, this demonstrates that it's a business that is reinvesting profits at increasing rates of return. In light of that, when we looked at Verizon Communications (NYSE:VZ) and its ROCE trend, we weren't exactly thrilled.
Understanding Return On Capital Employed (ROCE)
If you haven't worked with ROCE before, it measures the 'return' (pre-tax profit) a company generates from capital employed in its business. The formula for this calculation on Verizon Communications is:
Return on Capital Employed = Earnings Before Interest and Tax (EBIT) ÷ (Total Assets - Current Liabilities)
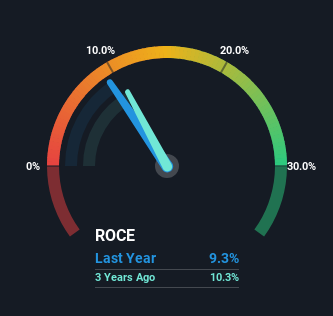
0.093 = US$30b ÷ (US$380b - US$54b) (Based on the trailing twelve months to March 2024).
Therefore, Verizon Communications has an ROCE of 9.3%. On its own that's a low return, but compared to the average of 5.6% generated by the Telecom industry, it's much better.
View our latest analysis for Verizon Communications
Above you can see how the current ROCE for Verizon Communications compares to its prior returns on capital, but there's only so much you can tell from the past. If you'd like to see what analysts are forecasting going forward, you should check out our free analyst report for Verizon Communications .
What The Trend Of ROCE Can Tell Us
In terms of Verizon Communications' historical ROCE movements, the trend isn't fantastic. Around five years ago the returns on capital were 13%, but since then they've fallen to 9.3%. On the other hand, the company has been employing more capital without a corresponding improvement in sales in the last year, which could suggest these investments are longer term plays. It's worth keeping an eye on the company's earnings from here on to see if these investments do end up contributing to the bottom line.
What We Can Learn From Verizon Communications' ROCE
Bringing it all together, while we're somewhat encouraged by Verizon Communications' reinvestment in its own business, we're aware that returns are shrinking. Additionally, the stock's total return to shareholders over the last five years has been flat, which isn't too surprising. All in all, the inherent trends aren't typical of multi-baggers, so if that's what you're after, we think you might have more luck elsewhere.
If you want to continue researching Verizon Communications, you might be interested to know about the 4 warning signs that our analysis has discovered.
While Verizon Communications isn't earning the highest return, check out this free list of companies that are earning high returns on equity with solid balance sheets.
Have feedback on this article? Concerned about the content? Get in touch with us directly. Alternatively, email editorial-team (at) simplywallst.com.
This article by Simply Wall St is general in nature. We provide commentary based on historical data and analyst forecasts only using an unbiased methodology and our articles are not intended to be financial advice. It does not constitute a recommendation to buy or sell any stock, and does not take account of your objectives, or your financial situation. We aim to bring you long-term focused analysis driven by fundamental data. Note that our analysis may not factor in the latest price-sensitive company announcements or qualitative material. Simply Wall St has no position in any stocks mentioned.
