
 Yahoo Finance
 Capital Allocation Trends At MTAG Group Berhad (KLSE:MTAG) Aren't Ideal
If we want to find a stock that could multiply over the long term, what are the underlying trends we should look for? In a perfect world, we'd like to see a company investing more capital into its business and ideally the returns earned from that capital are also increasing. Put simply, these types of businesses are compounding machines, meaning they are continually reinvesting their earnings at ever-higher rates of return. However, after investigating MTAG Group Berhad (KLSE:MTAG), we don't think it's current trends fit the mold of a multi-bagger.
Return On Capital Employed (ROCE): What Is It?
If you haven't worked with ROCE before, it measures the 'return' (pre-tax profit) a company generates from capital employed in its business. Analysts use this formula to calculate it for MTAG Group Berhad:
Return on Capital Employed = Earnings Before Interest and Tax (EBIT) ÷ (Total Assets - Current Liabilities)
0.10 = RM24m ÷ (RM238m - RM9.8m) (Based on the trailing twelve months to March 2024).
Thus, MTAG Group Berhad has an ROCE of 10%. In absolute terms, that's a satisfactory return, but compared to the Commercial Services industry average of 7.5% it's much better.
See our latest analysis for MTAG Group Berhad
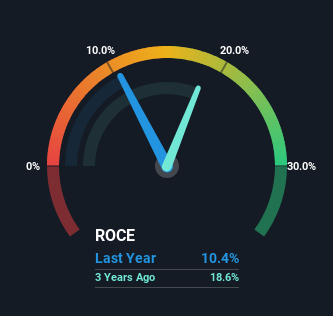
Historical performance is a great place to start when researching a stock so above you can see the gauge for MTAG Group Berhad's ROCE against it's prior returns. If you'd like to look at how MTAG Group Berhad has performed in the past in other metrics, you can view this free graph of MTAG Group Berhad's past earnings, revenue and cash flow.
What Can We Tell From MTAG Group Berhad's ROCE Trend?
On the surface, the trend of ROCE at MTAG Group Berhad doesn't inspire confidence. Around five years ago the returns on capital were 41%, but since then they've fallen to 10%. Given the business is employing more capital while revenue has slipped, this is a bit concerning. If this were to continue, you might be looking at a company that is trying to reinvest for growth but is actually losing market share since sales haven't increased.
On a related note, MTAG Group Berhad has decreased its current liabilities to 4.1% of total assets. That could partly explain why the ROCE has dropped. What's more, this can reduce some aspects of risk to the business because now the company's suppliers or short-term creditors are funding less of its operations. Some would claim this reduces the business' efficiency at generating ROCE since it is now funding more of the operations with its own money.
Our Take On MTAG Group Berhad's ROCE
We're a bit apprehensive about MTAG Group Berhad because despite more capital being deployed in the business, returns on that capital and sales have both fallen. Long term shareholders who've owned the stock over the last three years have experienced a 15% depreciation in their investment, so it appears the market might not like these trends either. With underlying trends that aren't great in these areas, we'd consider looking elsewhere.
If you'd like to know more about MTAG Group Berhad, we've spotted 4 warning signs, and 2 of them are significant.
While MTAG Group Berhad isn't earning the highest return, check out this free list of companies that are earning high returns on equity with solid balance sheets.
Have feedback on this article? Concerned about the content? Get in touch with us directly. Alternatively, email editorial-team (at) simplywallst.com.
This article by Simply Wall St is general in nature. We provide commentary based on historical data and analyst forecasts only using an unbiased methodology and our articles are not intended to be financial advice. It does not constitute a recommendation to buy or sell any stock, and does not take account of your objectives, or your financial situation. We aim to bring you long-term focused analysis driven by fundamental data. Note that our analysis may not factor in the latest price-sensitive company announcements or qualitative material. Simply Wall St has no position in any stocks mentioned.
Have feedback on this article? Concerned about the content? Get in touch with us directly. Alternatively, email editorial-team@simplywallst.com
