
 Yahoo Finance
 Capital Allocation Trends At Aeon (M) Bhd (KLSE:AEON) Aren't Ideal
If we want to find a stock that could multiply over the long term, what are the underlying trends we should look for? Firstly, we'll want to see a proven return on capital employed (ROCE) that is increasing, and secondly, an expanding base of capital employed. This shows us that it's a compounding machine, able to continually reinvest its earnings back into the business and generate higher returns. Although, when we looked at Aeon (M) Bhd (KLSE:AEON), it didn't seem to tick all of these boxes.
Understanding Return On Capital Employed (ROCE)
For those who don't know, ROCE is a measure of a company's yearly pre-tax profit (its return), relative to the capital employed in the business. To calculate this metric for Aeon (M) Bhd, this is the formula:
Return on Capital Employed = Earnings Before Interest and Tax (EBIT) ÷ (Total Assets - Current Liabilities)
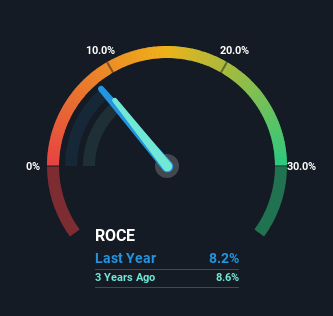
0.082 = RM305m ÷ (RM5.3b - RM1.6b) (Based on the trailing twelve months to September 2023).
So, Aeon (M) Bhd has an ROCE of 8.2%. Ultimately, that's a low return and it under-performs the Consumer Retailing industry average of 12%.
See our latest analysis for Aeon (M) Bhd
Above you can see how the current ROCE for Aeon (M) Bhd compares to its prior returns on capital, but there's only so much you can tell from the past. If you'd like, you can check out the forecasts from the analysts covering Aeon (M) Bhd here for free.
What Does the ROCE Trend For Aeon (M) Bhd Tell Us?
On the surface, the trend of ROCE at Aeon (M) Bhd doesn't inspire confidence. To be more specific, ROCE has fallen from 12% over the last five years. On the other hand, the company has been employing more capital without a corresponding improvement in sales in the last year, which could suggest these investments are longer term plays. It's worth keeping an eye on the company's earnings from here on to see if these investments do end up contributing to the bottom line.
On a related note, Aeon (M) Bhd has decreased its current liabilities to 30% of total assets. That could partly explain why the ROCE has dropped. Effectively this means their suppliers or short-term creditors are funding less of the business, which reduces some elements of risk. Some would claim this reduces the business' efficiency at generating ROCE since it is now funding more of the operations with its own money.
The Key Takeaway
In summary, Aeon (M) Bhd is reinvesting funds back into the business for growth but unfortunately it looks like sales haven't increased much just yet. Since the stock has declined 21% over the last five years, investors may not be too optimistic on this trend improving either. On the whole, we aren't too inspired by the underlying trends and we think there may be better chances of finding a multi-bagger elsewhere.
If you want to continue researching Aeon (M) Bhd, you might be interested to know about the 2 warning signs that our analysis has discovered.
For those who like to invest in solid companies, check out this free list of companies with solid balance sheets and high returns on equity.
Have feedback on this article? Concerned about the content? Get in touch with us directly. Alternatively, email editorial-team (at) simplywallst.com.
This article by Simply Wall St is general in nature. We provide commentary based on historical data and analyst forecasts only using an unbiased methodology and our articles are not intended to be financial advice. It does not constitute a recommendation to buy or sell any stock, and does not take account of your objectives, or your financial situation. We aim to bring you long-term focused analysis driven by fundamental data. Note that our analysis may not factor in the latest price-sensitive company announcements or qualitative material. Simply Wall St has no position in any stocks mentioned.
