
 Yahoo Finance
 Cambricon Technologies Leads Three Growth Stocks With High Insider Ownership
As global markets navigate through a landscape marked by fluctuating interest rates and mixed economic indicators, investors continue to seek stable yet promising opportunities. In this context, growth companies with high insider ownership can be particularly appealing, as significant insider stakes often signal confidence in the company's future prospects from those who know it best.
Top 10 Growth Companies With High Insider Ownership
Name | Insider Ownership | Earnings Growth |
Gaming Innovation Group (OB:GIG) | 26.7% | 36.9% |
Clinuvel Pharmaceuticals (ASX:CUV) | 13.6% | 26.7% |
Global Tax Free (KOSDAQ:A204620) | 18.1% | 72.4% |
KebNi (OM:KEBNI B) | 37.8% | 90.4% |
Seojin SystemLtd (KOSDAQ:A178320) | 27.9% | 54% |
Credo Technology Group Holding (NasdaqGS:CRDO) | 14.7% | 60.9% |
Calliditas Therapeutics (OM:CALTX) | 11.7% | 52.9% |
Vow (OB:VOW) | 31.8% | 97.6% |
Adocia (ENXTPA:ADOC) | 11.9% | 59.8% |
HANA Micron (KOSDAQ:A067310) | 20% | 96.3% |
We'll examine a selection from our screener results.
Cambricon Technologies
Simply Wall St Growth Rating: ★★★★★☆
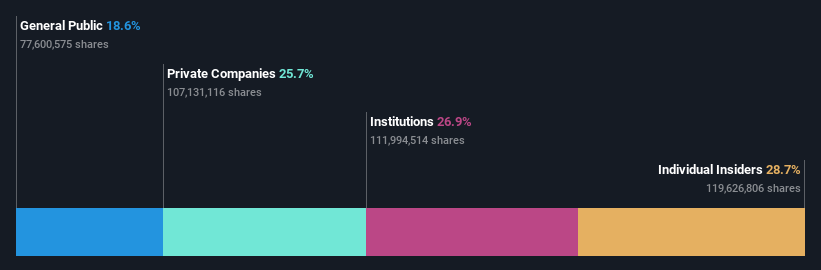
Overview: Cambricon Technologies Corporation Limited specializes in researching, developing, designing, and selling core chips for cloud servers, edge computing, and terminal equipment in China, with a market capitalization of approximately CN¥80.15 billion.
Operations: The company generates revenue by selling core chips, primarily for cloud servers, edge computing devices, and various terminal equipment in China.
Insider Ownership: 28.7%
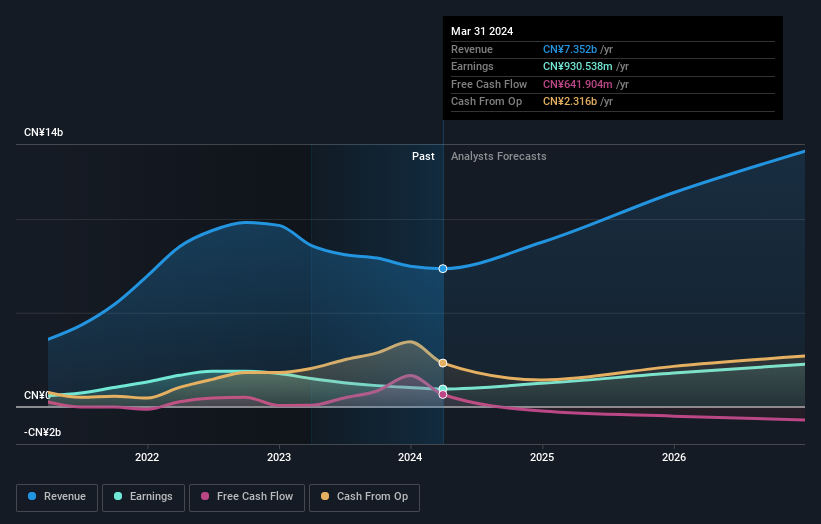
Cambricon Technologies is navigating a challenging financial landscape with its recent quarterly earnings showing a reduction in losses: CNY 226.68 million down from CNY 255.03 million year-over-year, and revenue at CNY 25.67 million, significantly lower than the previous year's CNY 75.29 million. Despite this downturn, the company is forecasted to achieve profitability within three years, with expected revenue growth at an impressive rate of 56.6% per year—outpacing the Chinese market average of 13.6%. This growth trajectory underscores its potential as a growth company despite current volatility and lack of insider trading activity in recent months.
Shenzhen Capchem Technology
Simply Wall St Growth Rating: ★★★★★☆
Overview: Shenzhen Capchem Technology Co., Ltd. specializes in researching, developing, producing, selling, and servicing electronic chemical products and functional materials in China, with a market capitalization of approximately CN¥20.72 billion.
Operations: The company generates revenue primarily from the production and sale of electronic chemical products and functional materials.
Insider Ownership: 39.3%
Shenzhen Capchem Technology, amid a backdrop of significant share repurchases totaling CNY 49.34 million, exhibits robust growth forecasts with earnings and revenue expected to expand by 27.5% and 20.6% per year respectively, surpassing the Chinese market averages. Despite a low forecasted Return on Equity at 17.3% and an unstable dividend record, the company's strategic buybacks and favorable valuation (P/E ratio of 24.4x) reflect a proactive stance in enhancing shareholder value while navigating market challenges effectively.
Gudeng Precision Industrial
Simply Wall St Growth Rating: ★★★★★★
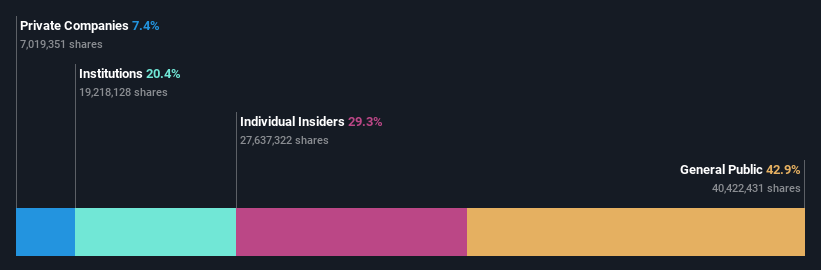
Overview: Gudeng Precision Industrial Co., Ltd. operates globally, offering technology services with a market capitalization of approximately NT$48.47 billion.
Operations: The company's revenue is primarily derived from semiconductor manufacturing and semiconductor equipment manufacturing, generating NT$3.64 billion and NT$1.28 billion respectively.
Insider Ownership: 29.3%
Gudeng Precision Industrial Co., Ltd. is poised for substantial growth, with earnings and revenue projected to increase by 37.2% and 25% per year respectively, outpacing the TW market averages significantly. Despite recent shareholder dilution, the company maintains a strong forecast Return on Equity of 21.1%. Recent executive reshuffles aim to bolster its governance as it continues to navigate challenges effectively, including the successful resolution of a patent infringement lawsuit without financial repercussions.
Make It Happen
Take a closer look at our Fast Growing Companies With High Insider Ownership list of 1447 companies by clicking here.
Are any of these part of your asset mix? Tap into the analytical power of Simply Wall St's portfolio to get a 360-degree view on how they're shaping up.
Streamline your investment strategy with Simply Wall St's app for free and benefit from extensive research on stocks across all corners of the world.
Contemplating Other Strategies?
Explore high-performing small cap companies that haven't yet garnered significant analyst attention.
Diversify your portfolio with solid dividend payers offering reliable income streams to weather potential market turbulence.
Find companies with promising cash flow potential yet trading below their fair value.
This article by Simply Wall St is general in nature. We provide commentary based on historical data and analyst forecasts only using an unbiased methodology and our articles are not intended to be financial advice. It does not constitute a recommendation to buy or sell any stock, and does not take account of your objectives, or your financial situation. We aim to bring you long-term focused analysis driven by fundamental data. Note that our analysis may not factor in the latest price-sensitive company announcements or qualitative material. Simply Wall St has no position in any stocks mentioned.The analysis only considers stock directly held by insiders. It does not include indirectly owned stock through other vehicles such as corporate and/or trust entities. All forecast revenue and earnings growth rates quoted are in terms of annualised (per annum) growth rates over 1-3 years.
Companies discussed in this article include SHSE:688256 SZSE:300037 and TPEX:3680.
Have feedback on this article? Concerned about the content? Get in touch with us directly. Alternatively, email editorial-team@simplywallst.com
